Grouping, charts and subreports
Grouping by a field with its own header and footer, summing with aggregates, drawing charts on paper and embedding one report inside another.
A detail band on its own only knows how to print one line per record. What turns a listing into a document is three pieces: grouping, which breaks the list into blocks with a title and a total; charts, which sum up what the list says; and subreports, which bring a completely different dataset into the document.
We continue in the Opportunities by account report of the Customer Management app.
Grouping
A group breaks the list every time a field's value changes. Each level brings two bands of its own: a header, rendered when the value changes, and a footer, rendered when the value ends.
That is what makes the document go "each account, with its opportunities underneath and the total at the end".
Creating a group
- In the left column, click the + of the Grouping section.
- Select the Header: … band that appeared on the design surface.
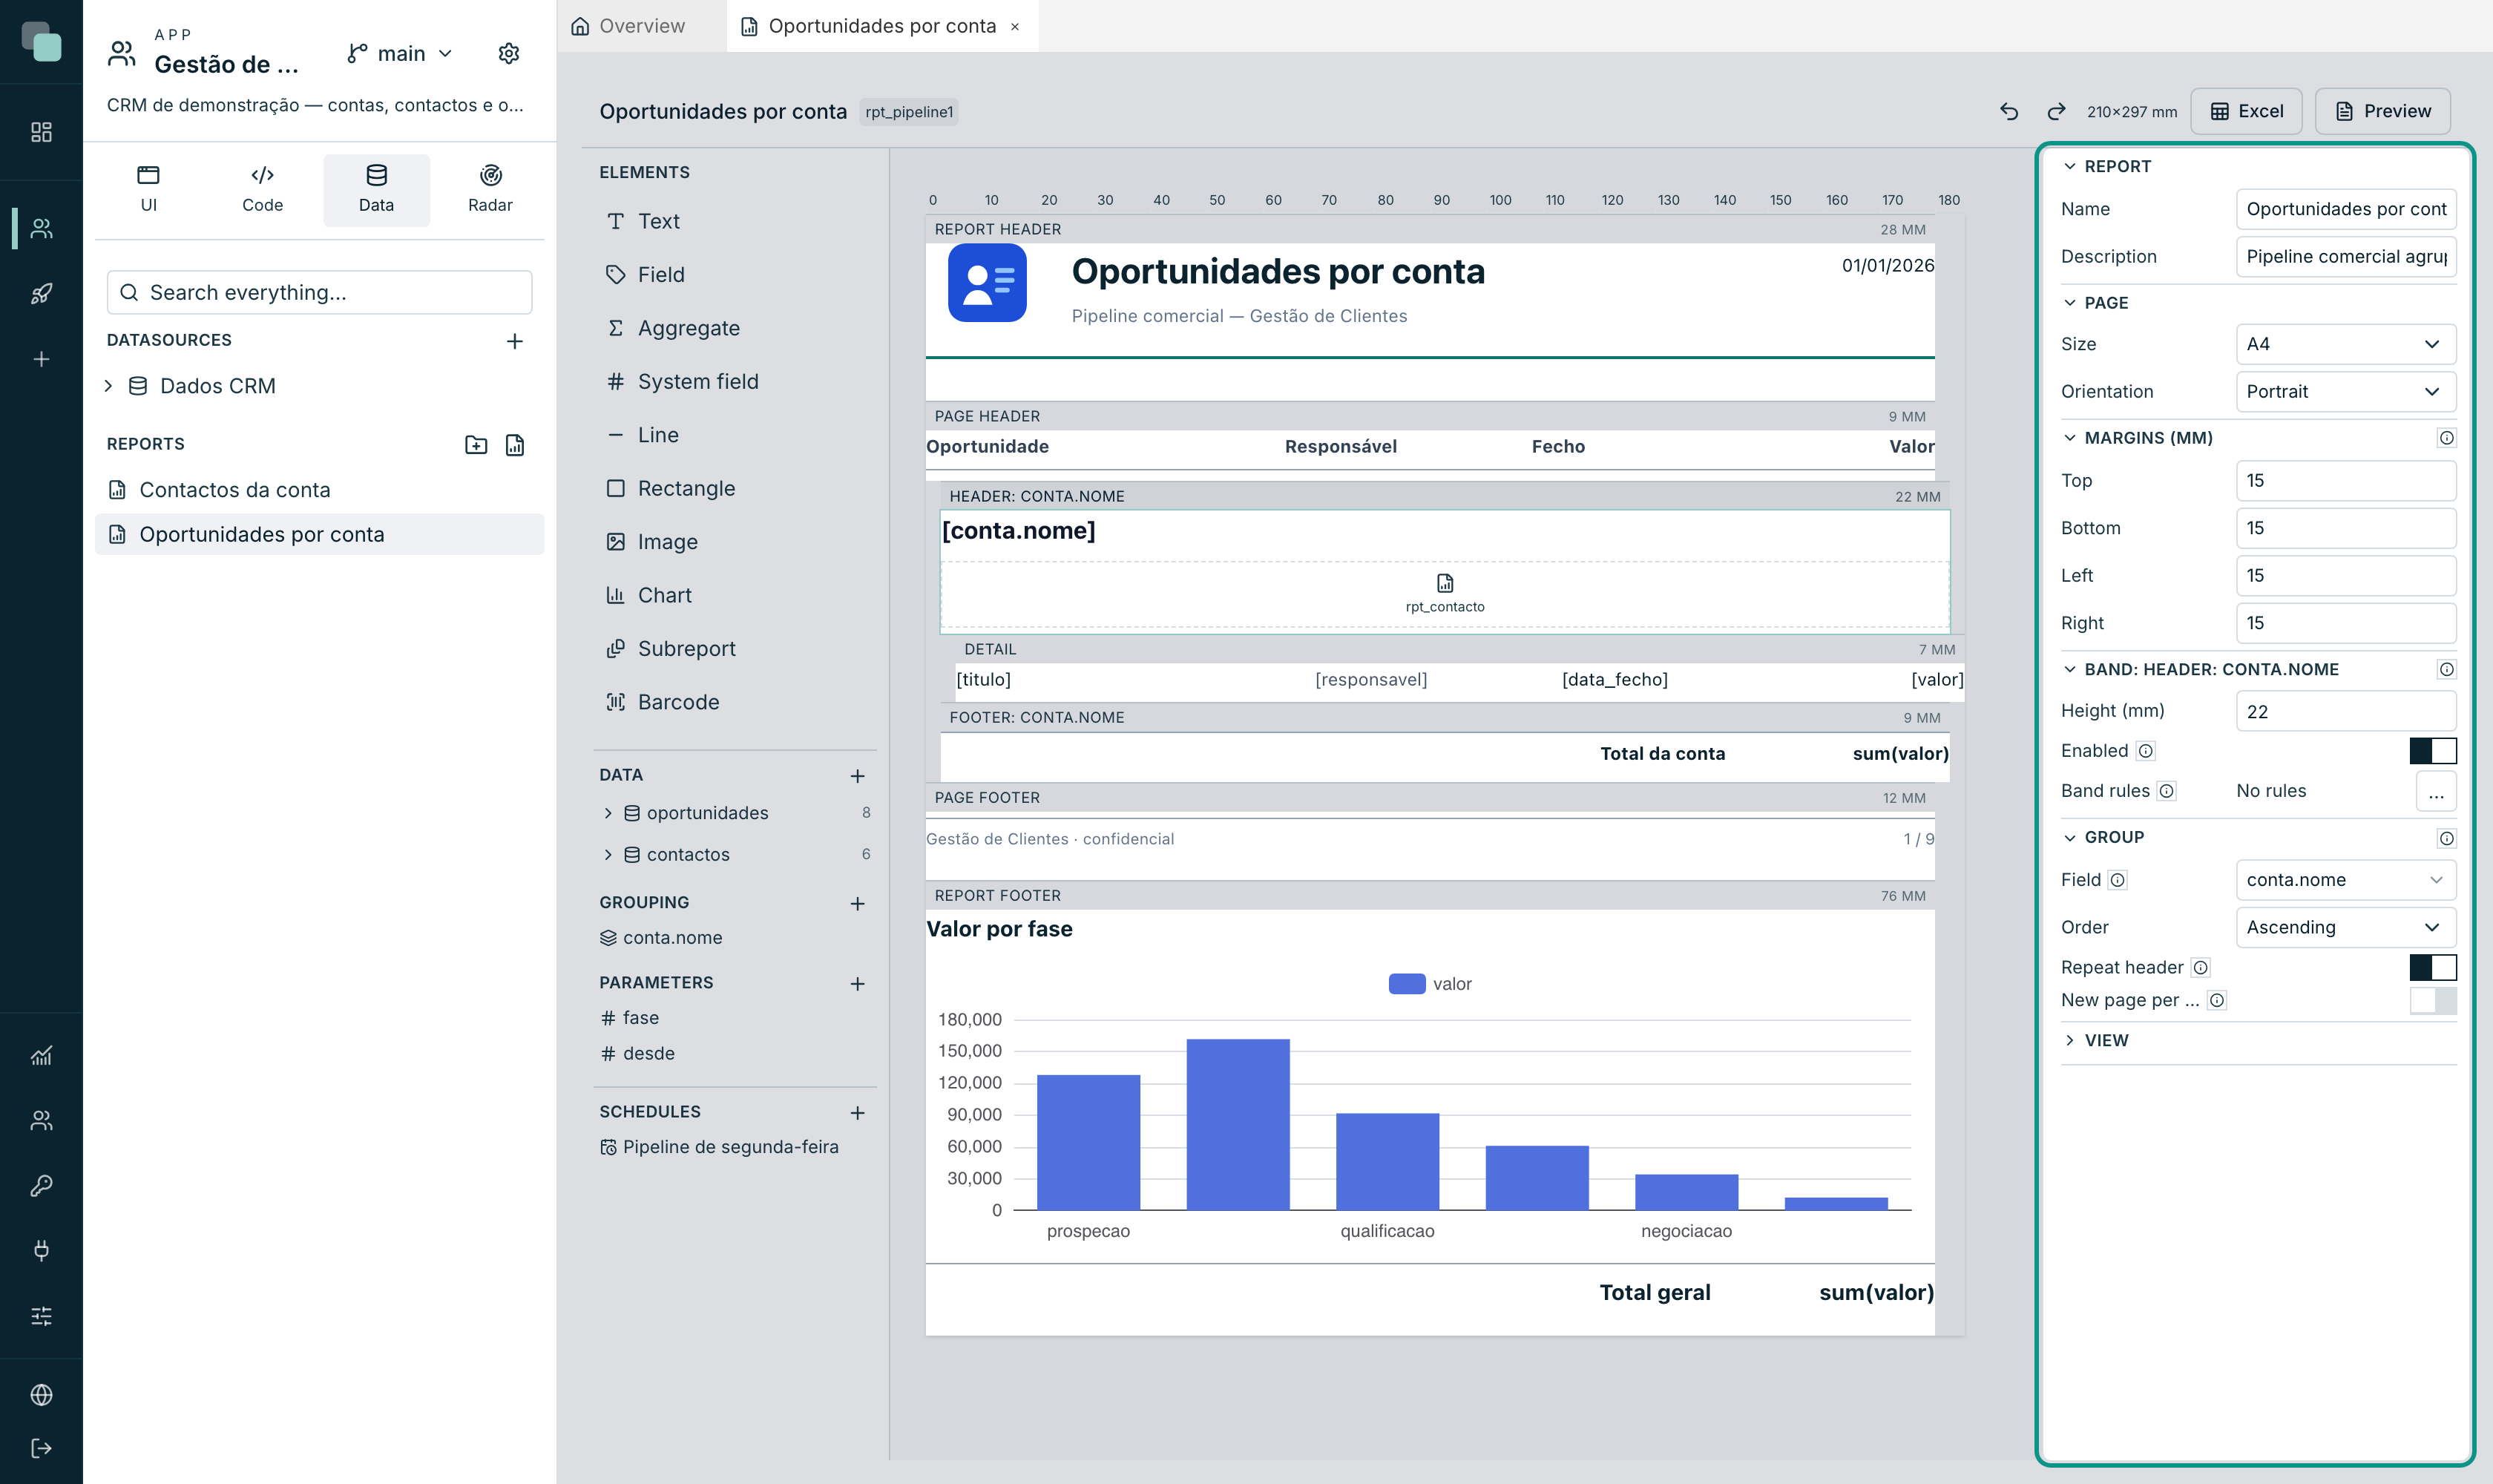
- In the right panel, in the Group section, choose the Field.
| Property | What it does |
|---|---|
| Field | "Field of the main dataset whose value defines the group. Rows are sorted by it." It accepts dotted paths to navigate relations: conta.nome. |
| Order | Ascending or Descending. |
| Repeat header | "When the group continues onto the next page, its header is rendered again at the top." |
| New page per group | "Each group starts on a page of its own." It is what you switch on to print one invoice per sheet. |
The group bands appear on the design surface nested around the detail, with an indentation that shows which level they belong to. You can have as many levels as you like — by year, then by customer, then by invoice.
Tip
A field inside a group header reads the group's first row. That is what makes the account's name appear above its opportunities. Outside the group bands (in the report header, for example) there is no row at all and the field comes out empty.
Totals with the Aggregate
The Aggregate element is a calculation done by the engine: Sum, Average, Count, Minimum or Maximum over a field of a dataset.
Where you put it decides what it counts:
| Where it sits | What it sums |
|---|---|
| In a group's footer | Only that group's rows — that account's total. |
| In the report footer | Every row — the grand total. |
| In the detail band, over a linked dataset | Only that row's rows — that invoice's total. |
On Count, the field can stay empty: it counts rows, not values.
Charts
A chart on paper uses the same engine and the same options as the screens' chart widget. In the PDF it is drawn on the server and goes in as vector, not as an image — a rasterized chart would come out blurry when printing or zooming.
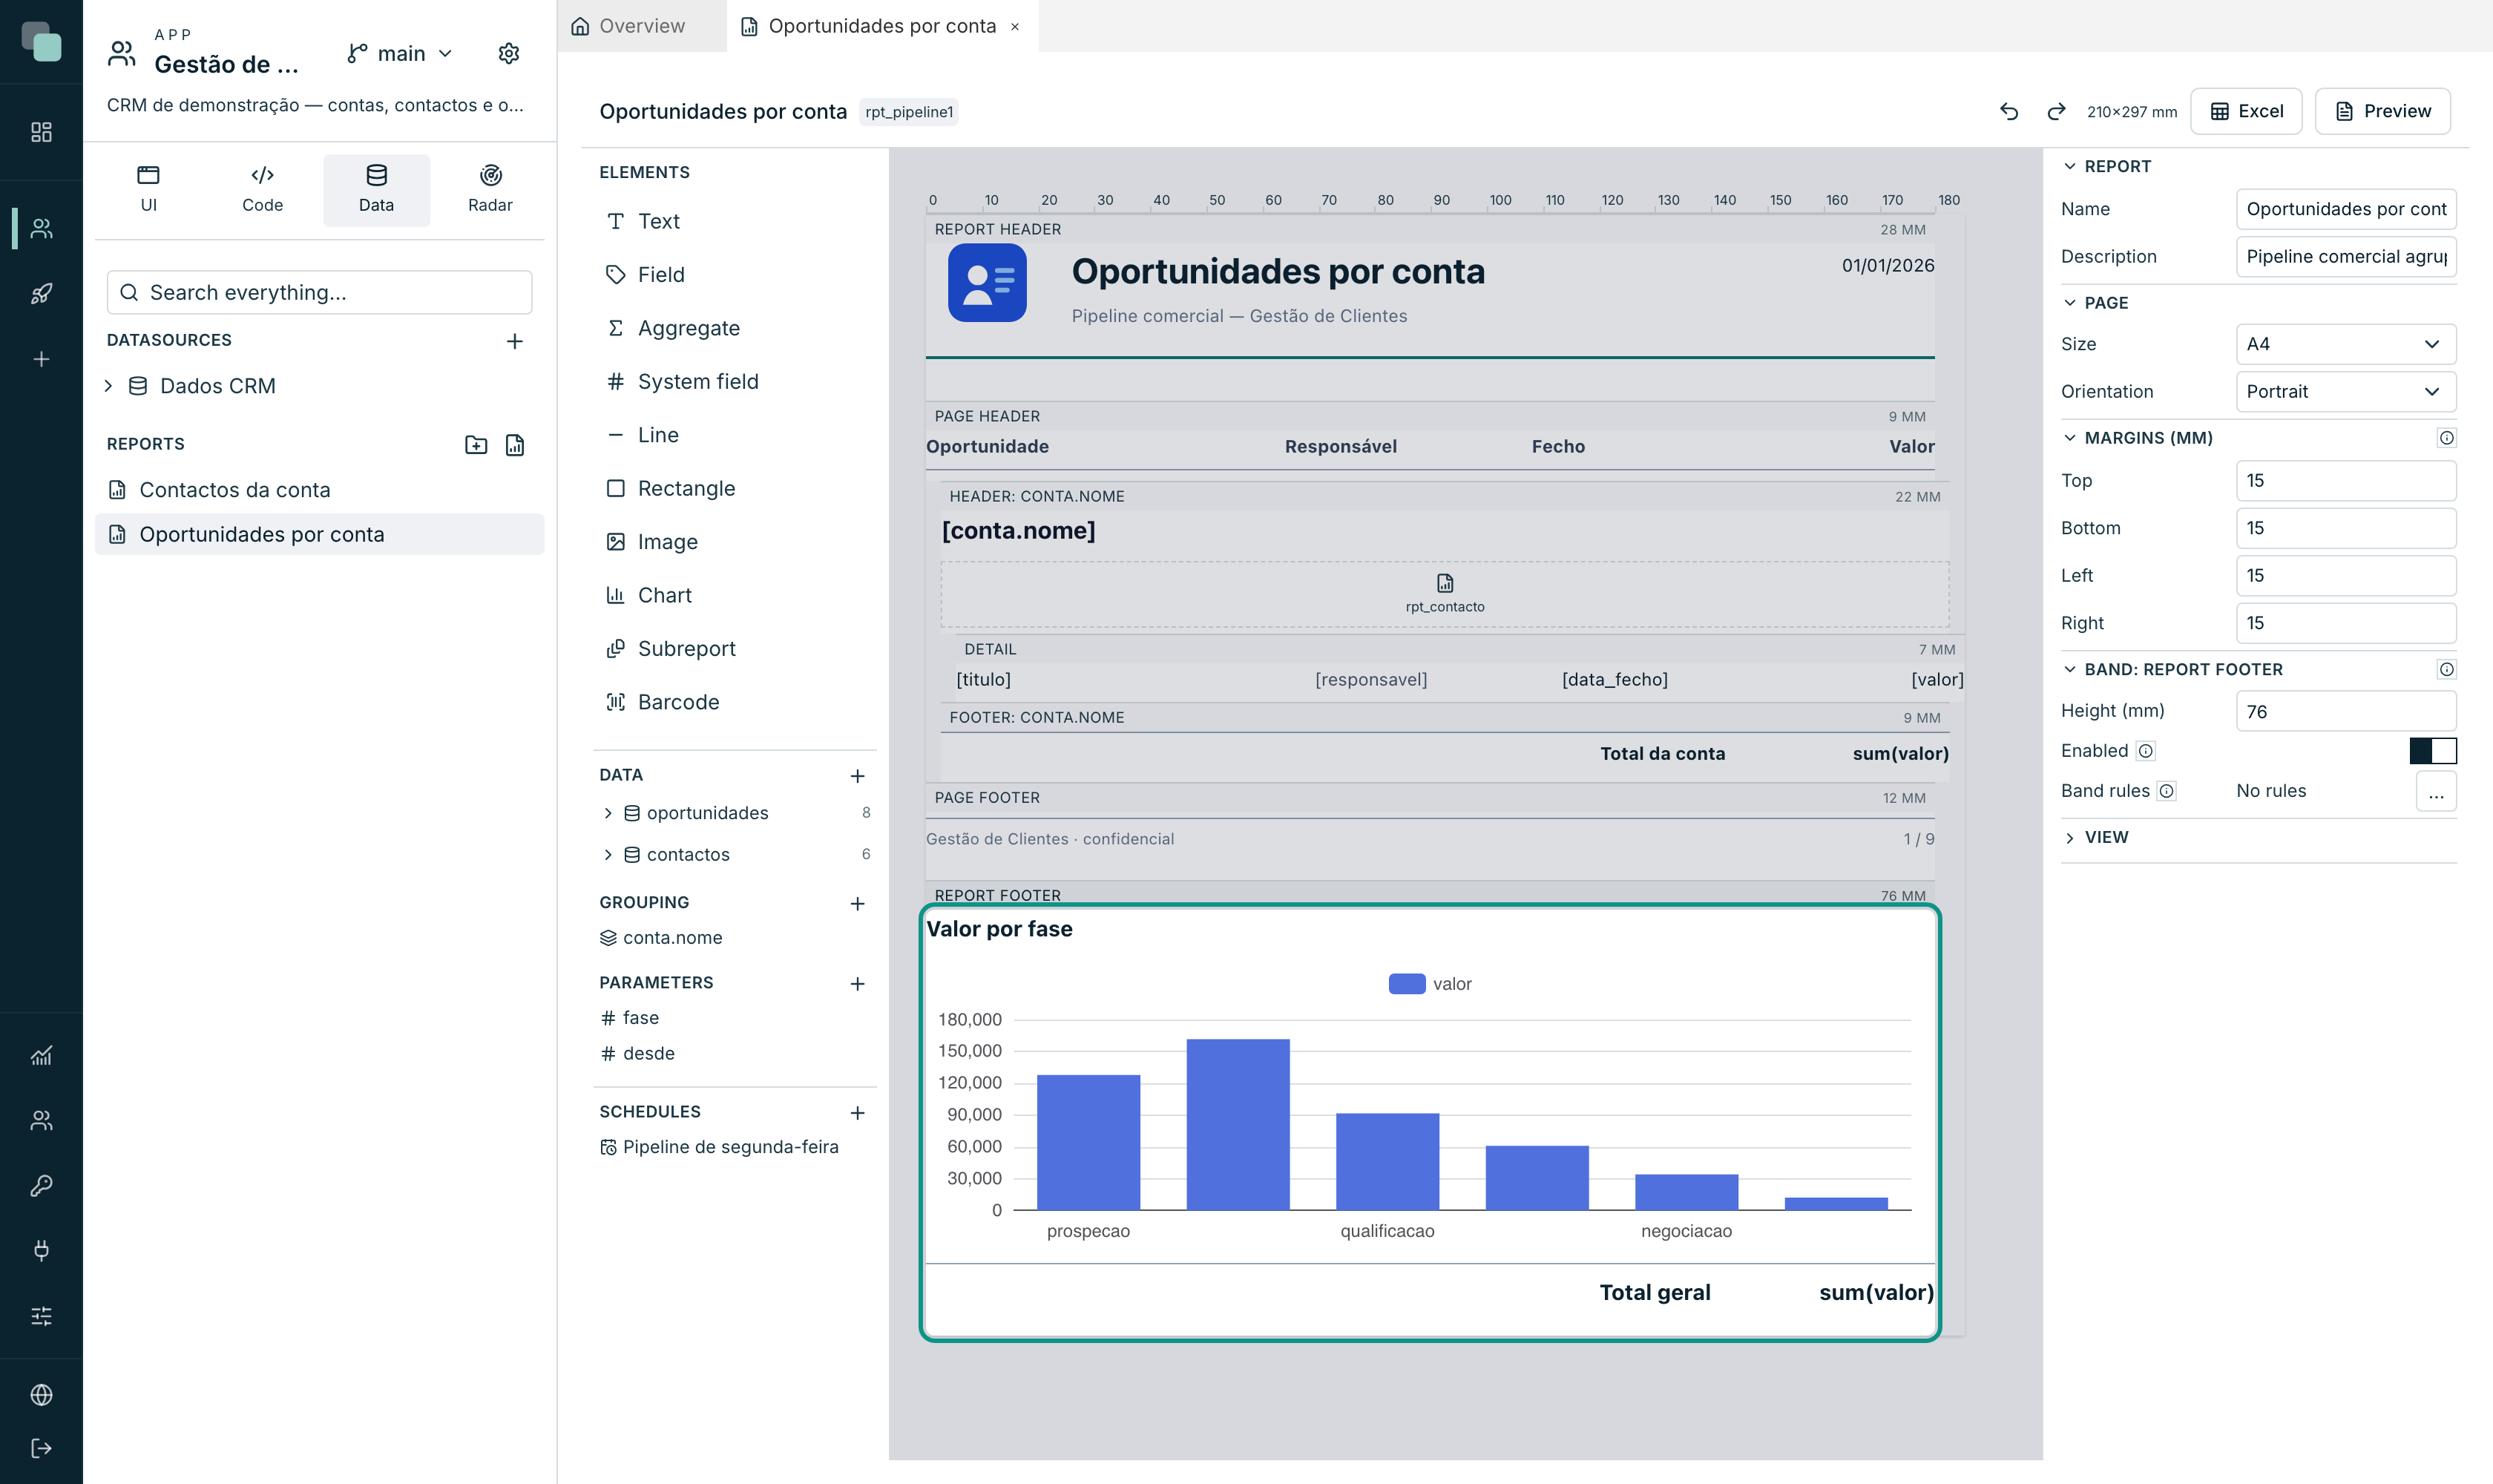
Drag Chart from the palette onto a band and configure it:
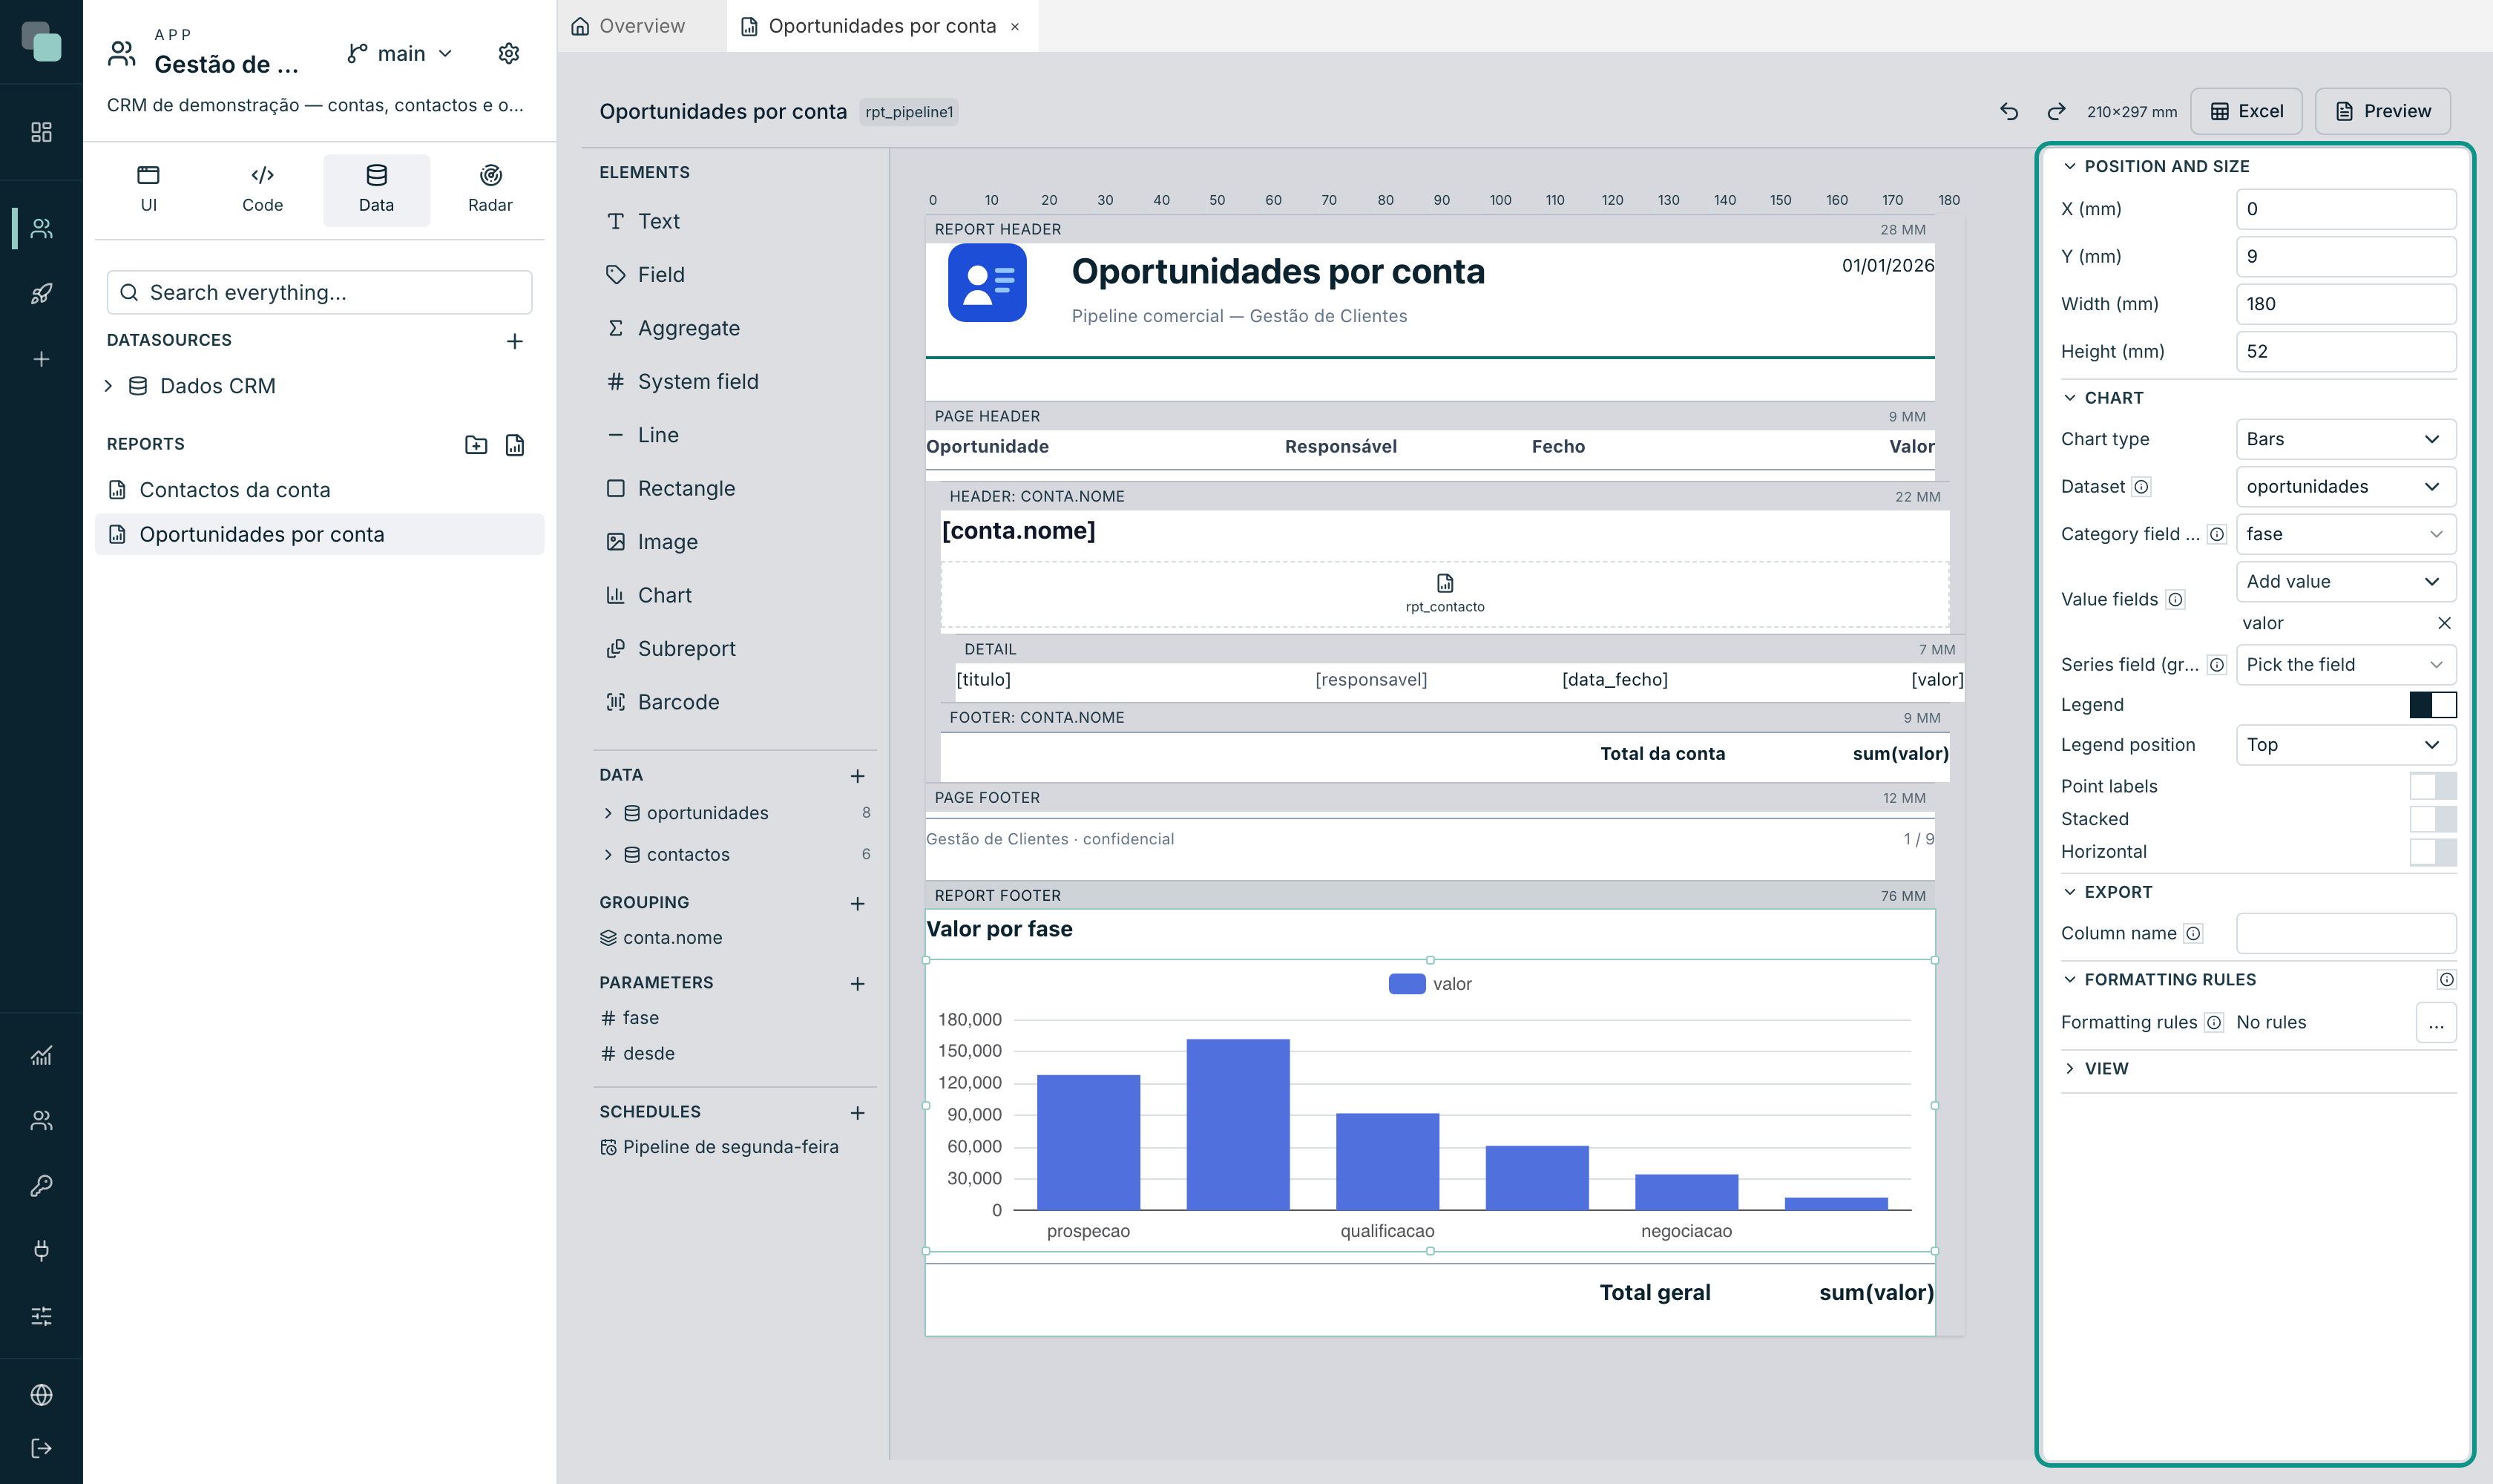
| Property | Notes |
|---|---|
| Chart type | Bars, Line, Area, Pie / Donut, Scatter, Radar, Funnel, Gauge or Heatmap. |
| Dataset | Where the rows come from. Empty uses the main dataset. |
| Category field (X axis / slices) | "Field that defines the horizontal axis (or the slices)." |
| Value fields | "Numeric fields to plot. With no series field, each one is a series." They are added with Add value. |
| Series field (grouping) | "Field that splits the series. With it, the first value field is pivoted." |
| Legend and Legend position | Top, Bottom, Left or Right. |
| Point labels | Writes the number on top of each bar or point. |
Depending on the type, Stacked, Smooth lines, Horizontal and Donut inner radius (%) also appear.
In the example, the Report footer chart has category fase and value
valor: one bar per pipeline stage, with the sum of each stage's deals.
Note
A chart in a group band draws that group's data — one chart per account. In a detail band it would draw one chart per printed row, which is almost never what you want.
Subreports
A subreport is another report drawn inside this one. It does what grouping cannot: grouping breaks up one dataset; the subreport brings a whole other one.
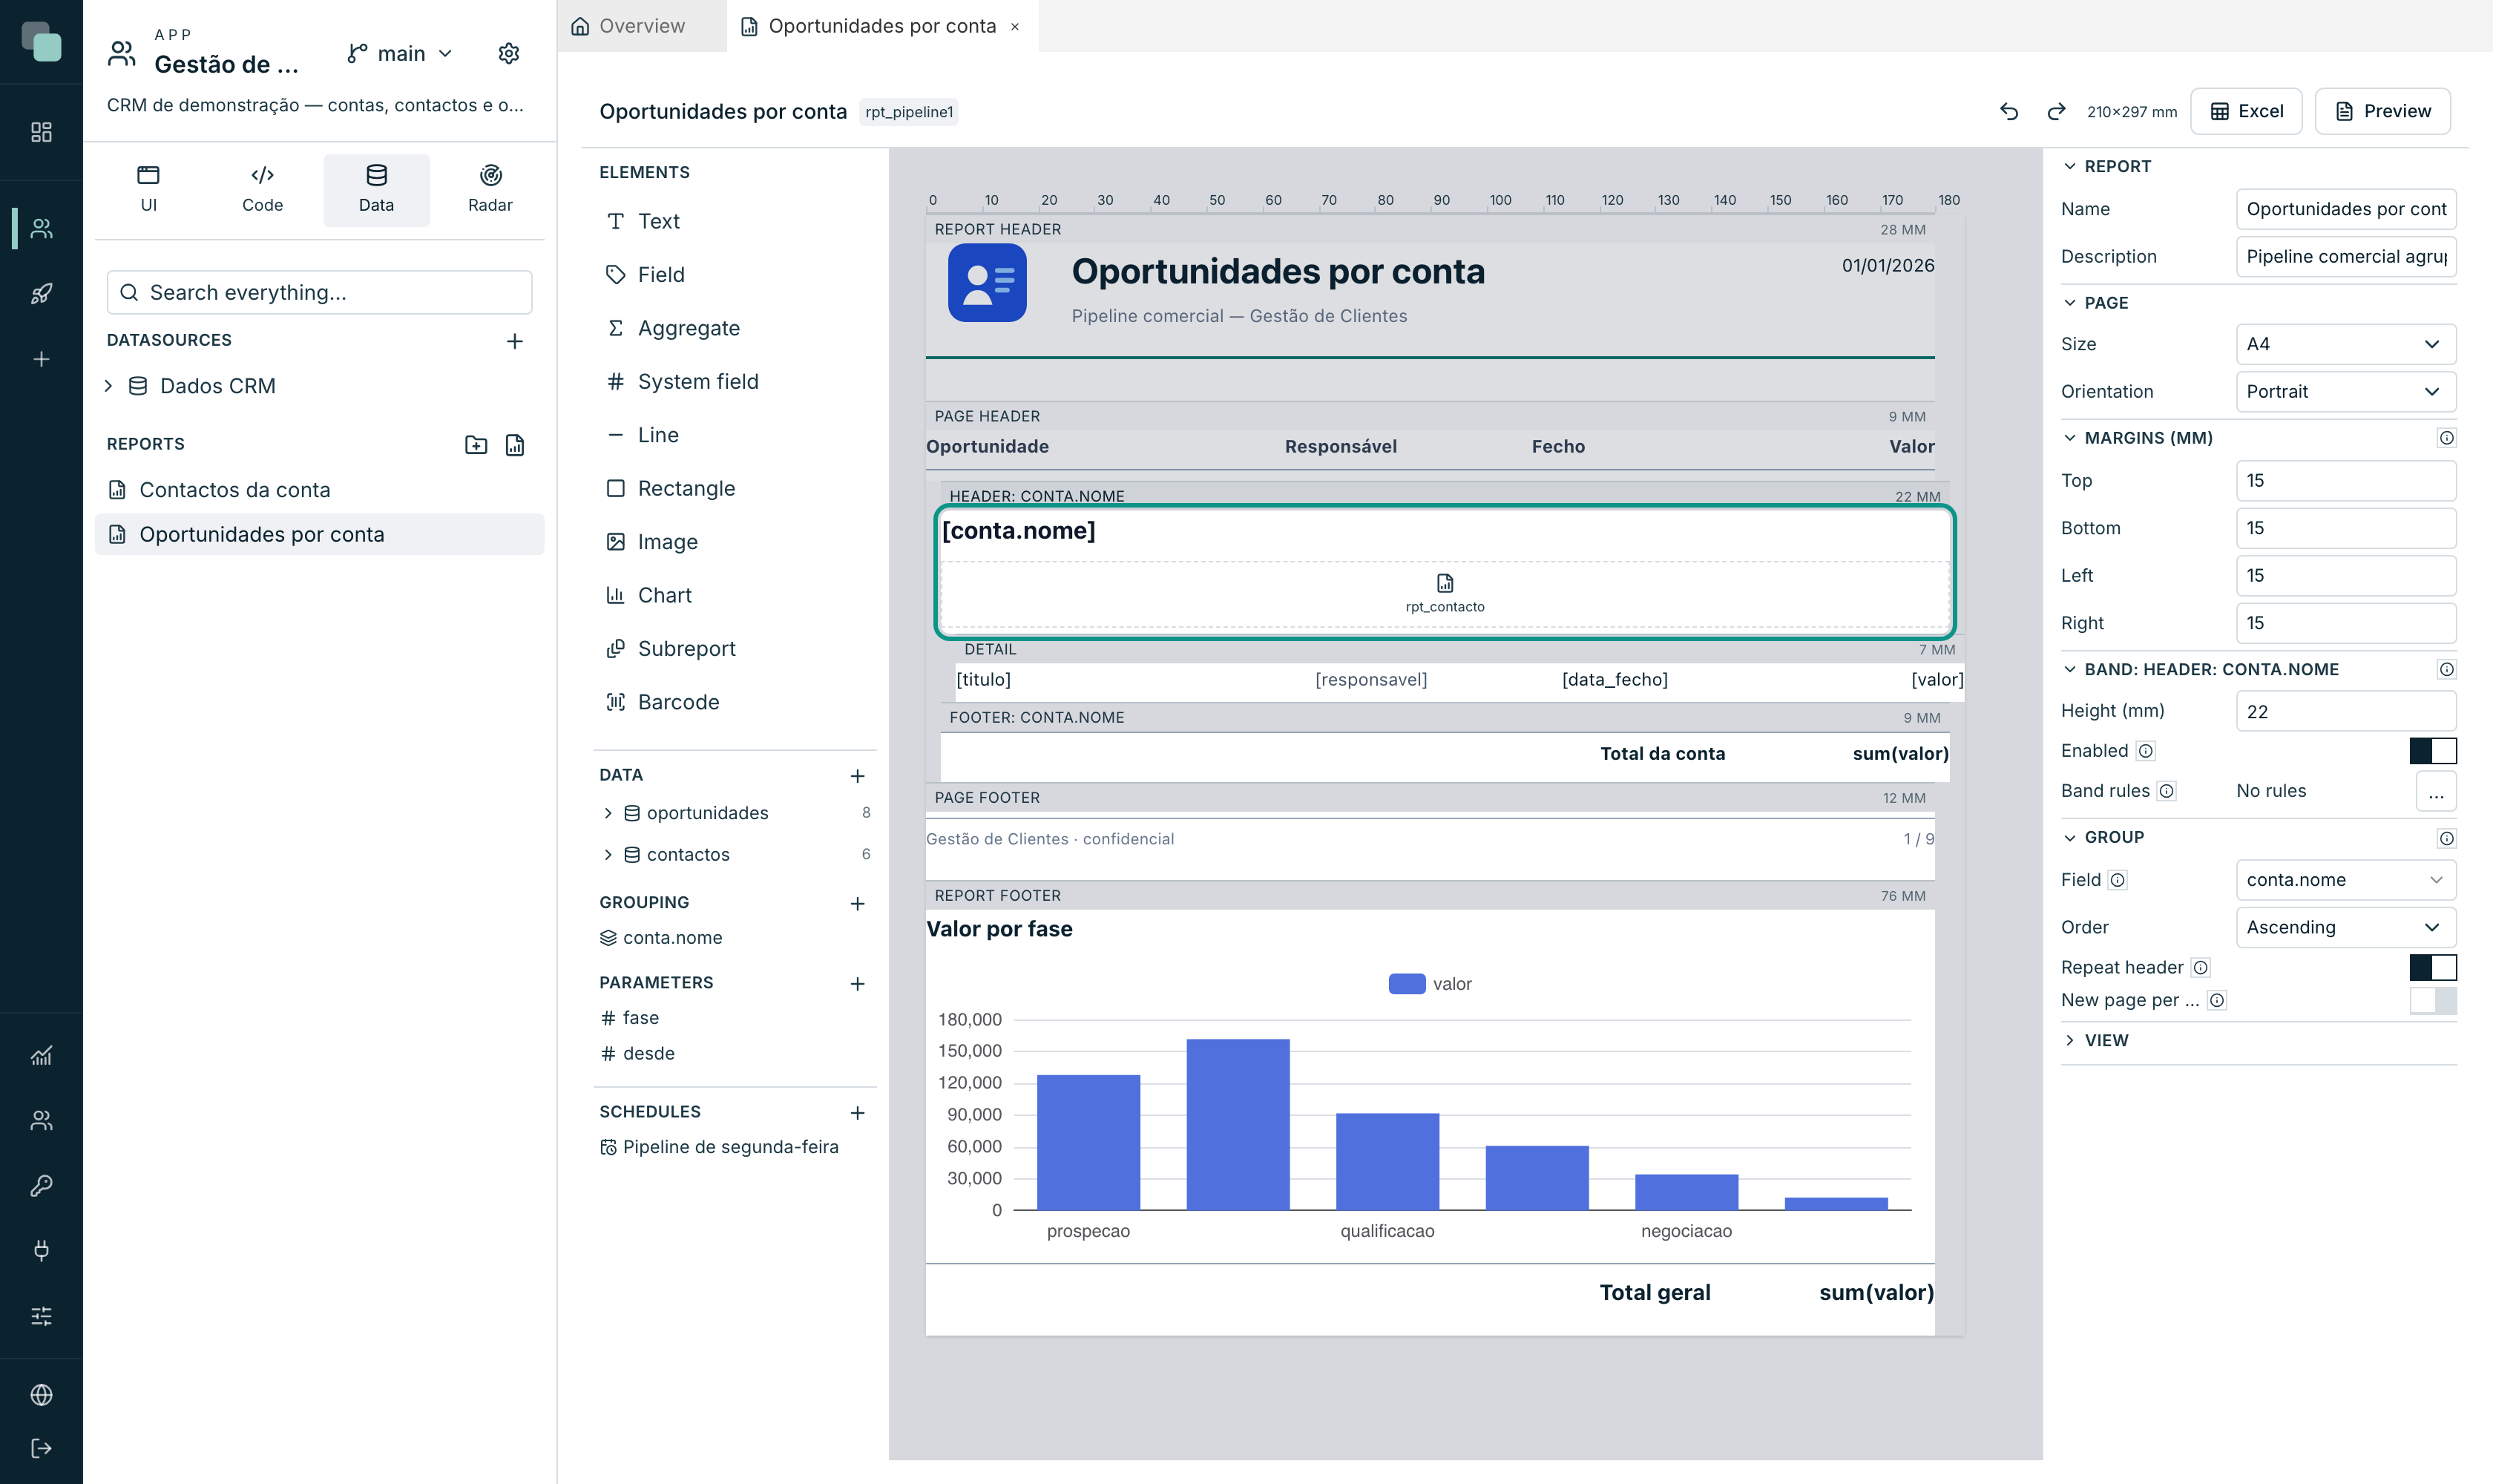
The classic case: on a statement of account, the open invoices and the payments — two lists from different tables on the same sheet. In our example, each account's header brings the list of its contacts, before the opportunities.
Designing the child
The embedded report is a normal report, with a life of its own — it opens, is designed and is previewed like any other. The difference is that it declares parameters to receive the context from whoever embeds it.
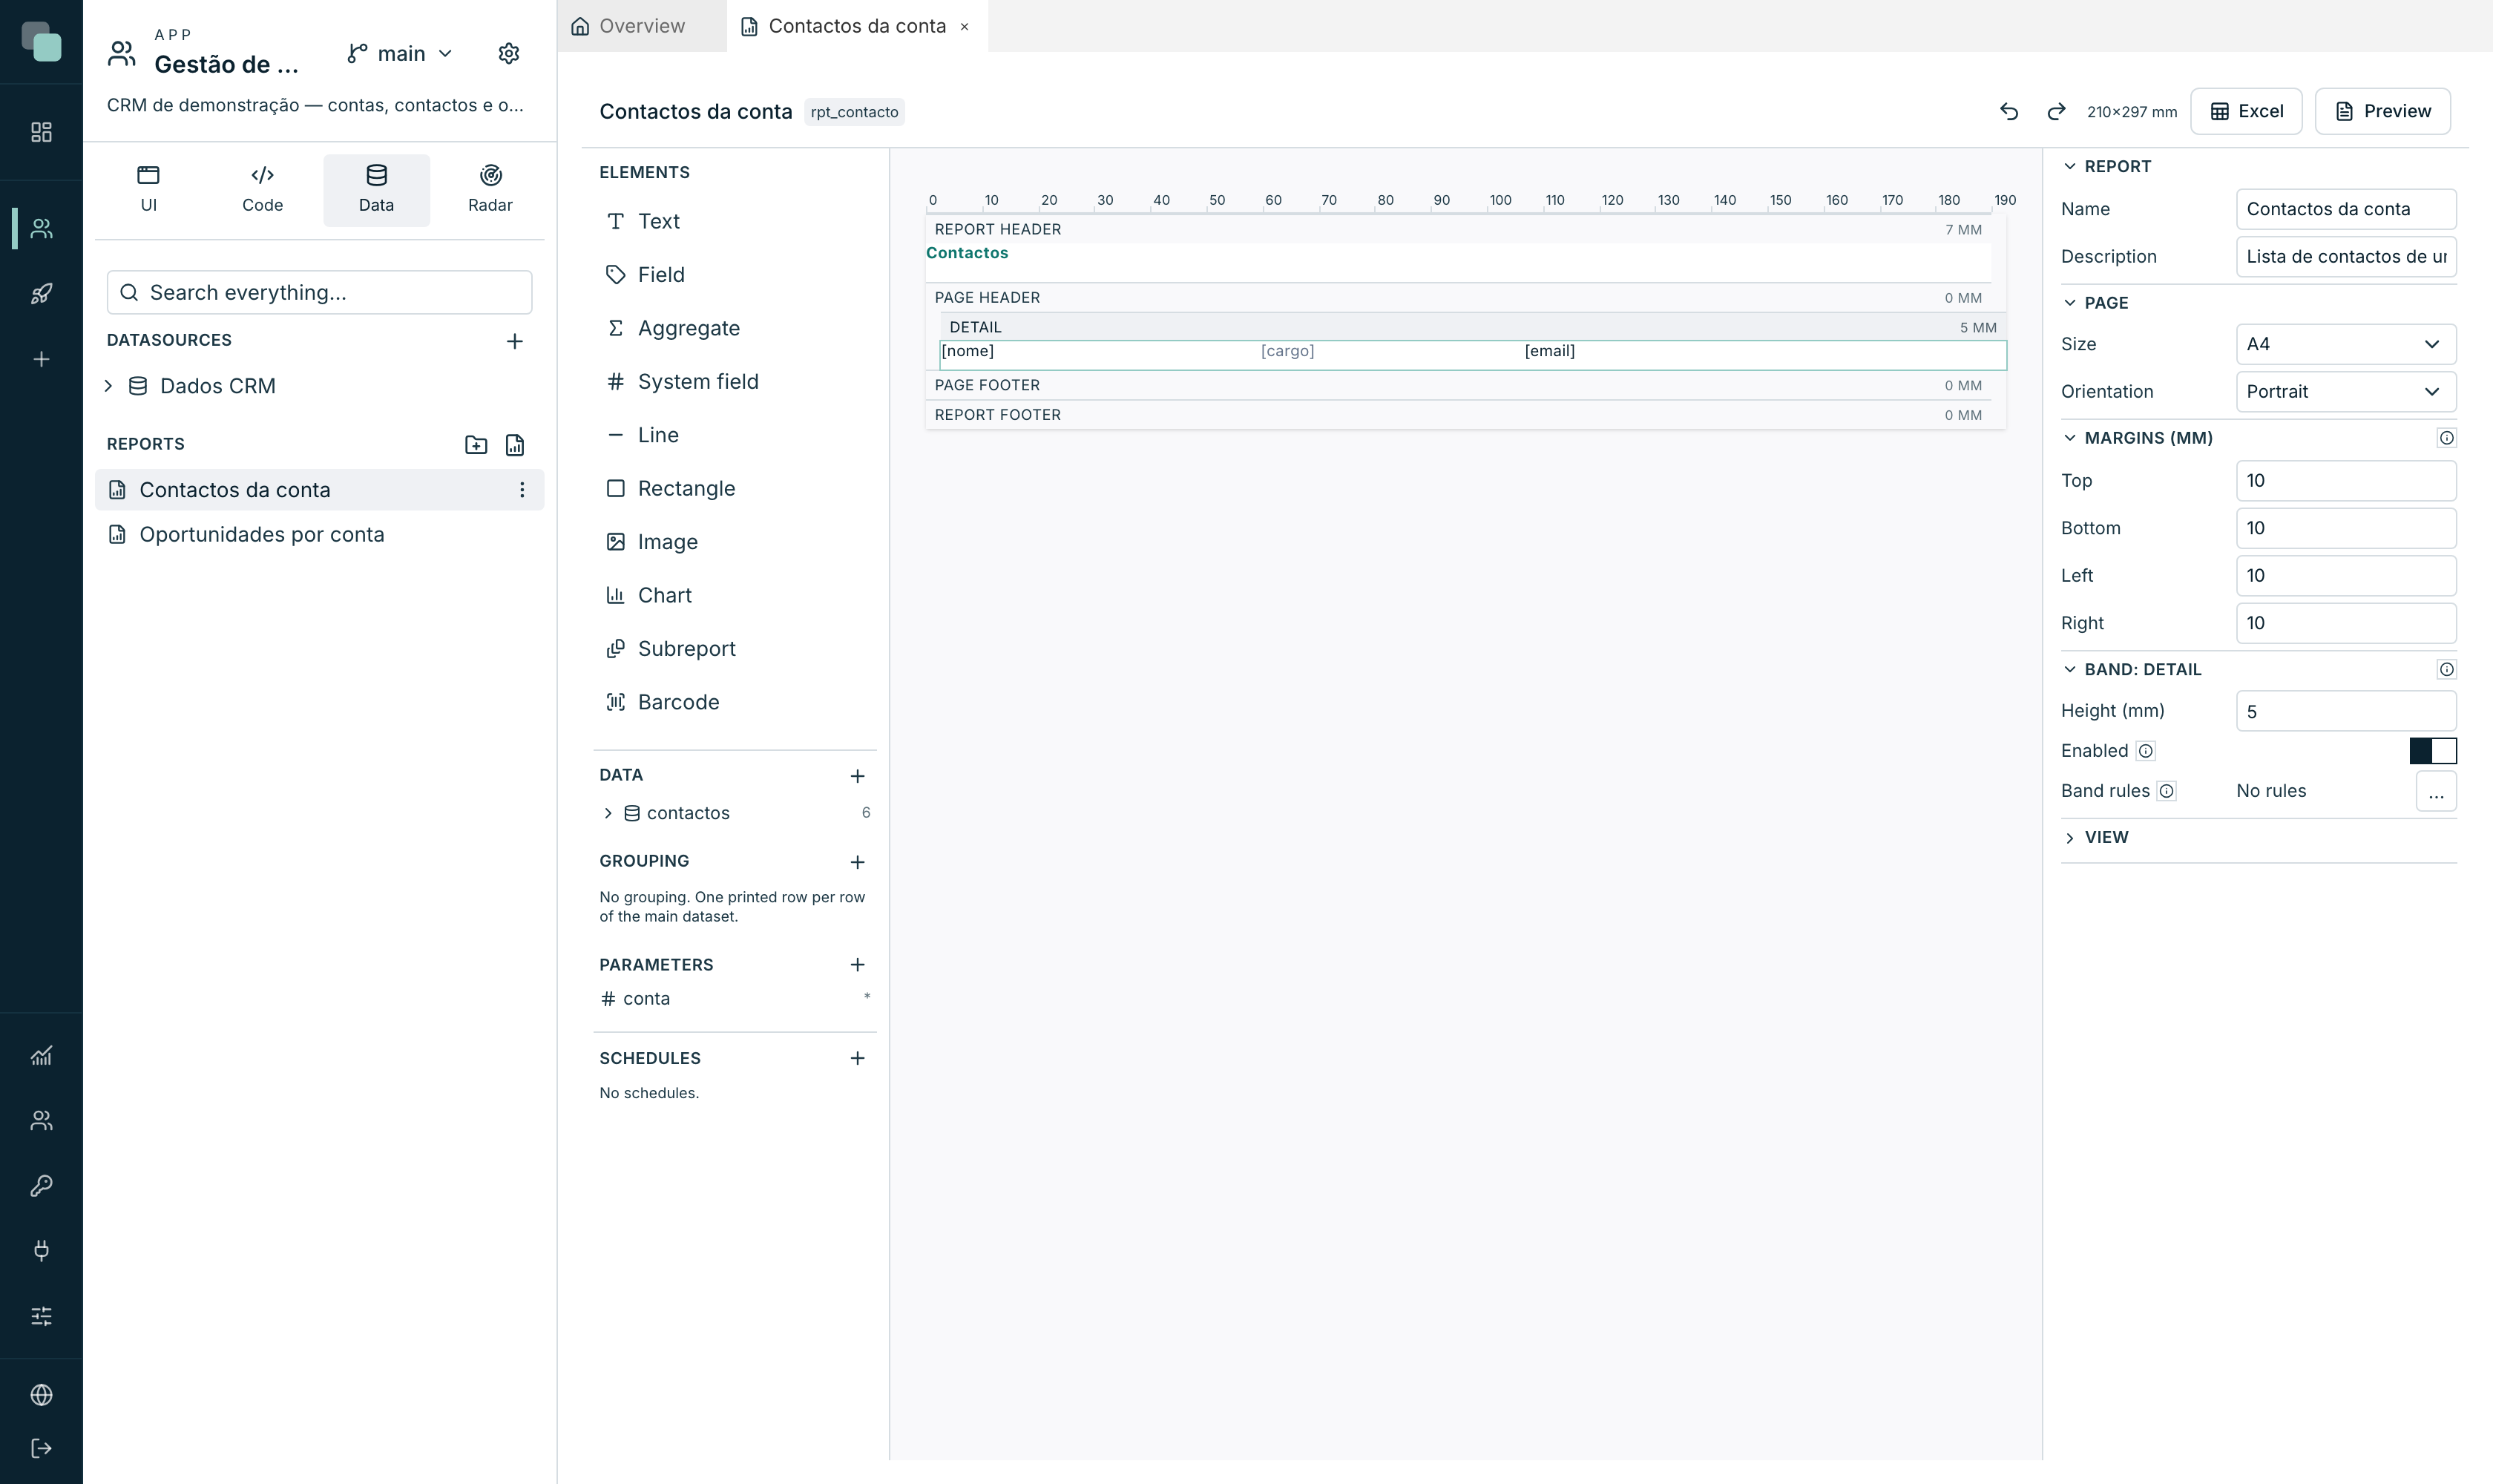
In the example, Contactos da conta has a conta parameter (Number,
required) and its dataset filters conta_id by that parameter. The bands
that do not matter in an embedded document — page header, footers — are
disabled.
Embedding
- Drag Subreport from the palette onto a header, a footer or a group band.
- In Pick the report, choose the child.
- For each of its parameters, say where it comes from: Row field (reads the field of the row where the subreport sits) or Fixed value.
Warning
A subreport cannot sit in the detail band, and that is prevented, not warned about: "it would run a query per printed row" — a thousand invoices, a thousand trips to the database. Put it in a header, a footer or a group band, where the occurrences are few.
Repetitions with the same parameters share the read, so a subreport in a group header costs one query per group, not per row.
Barcodes and images
Two elements that complete a business document:
Barcode — the value can come from a field (the normal thing on an invoice) or be fixed:
| Field | Notes |
|---|---|
| Type | Code 128 accepts text and numbers. EAN-13 is 12 or 13 digits and verifies the check digit. QR accepts any text — it is the invoices' one. |
| Field | "Field holding the value to encode. Empty uses the fixed value below." |
| Fixed value | Used only when no field is chosen. |
| Show the value | Prints the value below the bars (does not apply to QR). |
Image — the Source picks where it comes from:
| Source | What you fill in |
|---|---|
| App file | A file uploaded to the app (for example icons/logo.svg). |
| URL | A URL. |
| Data field | "Field holding the image: a URL, a path under assets, or the binary in base64." |
The Fit decides what happens when the image does not have the box's shape: Contain, Cover or Stretch.
An image from a URL, or from a URL that comes in a Data field, is only fetched from public internet addresses, never from the server's internal network, with up to 10 seconds and 10 MB. An image that cannot be fetched is left out, and the report comes out without it.
Frequently asked questions
The group groups nothing — it all comes out in a run. The group's field has to belong to the main dataset, and the rows are sorted by it. If the field is empty on many rows, they all fall into the same group.
The group's total is summing everything. The aggregate sits outside the group's band. Put it in that group's footer — the position is what defines the calculation's scope.
The chart comes out blank in the PDF but shows on the design surface. On the design surface, a chart with no data shows a sample. In the PDF there is only what the data gives: check the Dataset, the Category field and that at least one Value field is chosen.
Can I put a subreport inside another subreport? Yes, with the same rule: never in the detail band. But think twice — two levels of embedding make the document hard to predict, and often what was wanted was one more level of grouping.