Investigating a problem
From the symptom to the cause — an API's panel, a session's timeline, an error's chain, and the state of the issues.
Investigating is going from the symptom to the cause without guessing along the way. The Radar is designed for that route: you pick what failed, you see each execution one by one, and you follow it backwards to the step that started it.
This page walks that route in four stages — the API, the session, the issue, and the audit log that explains why now.
An API that fails
- Open the app and go to Radar.
- In the APIs and scripts section, click the API's row — for example
oportunidades. - A tab opens with its name, and at the top three tags: the internal name, 116 calls and 4ms average. When there are failures, "N failures (X%)" appears too.
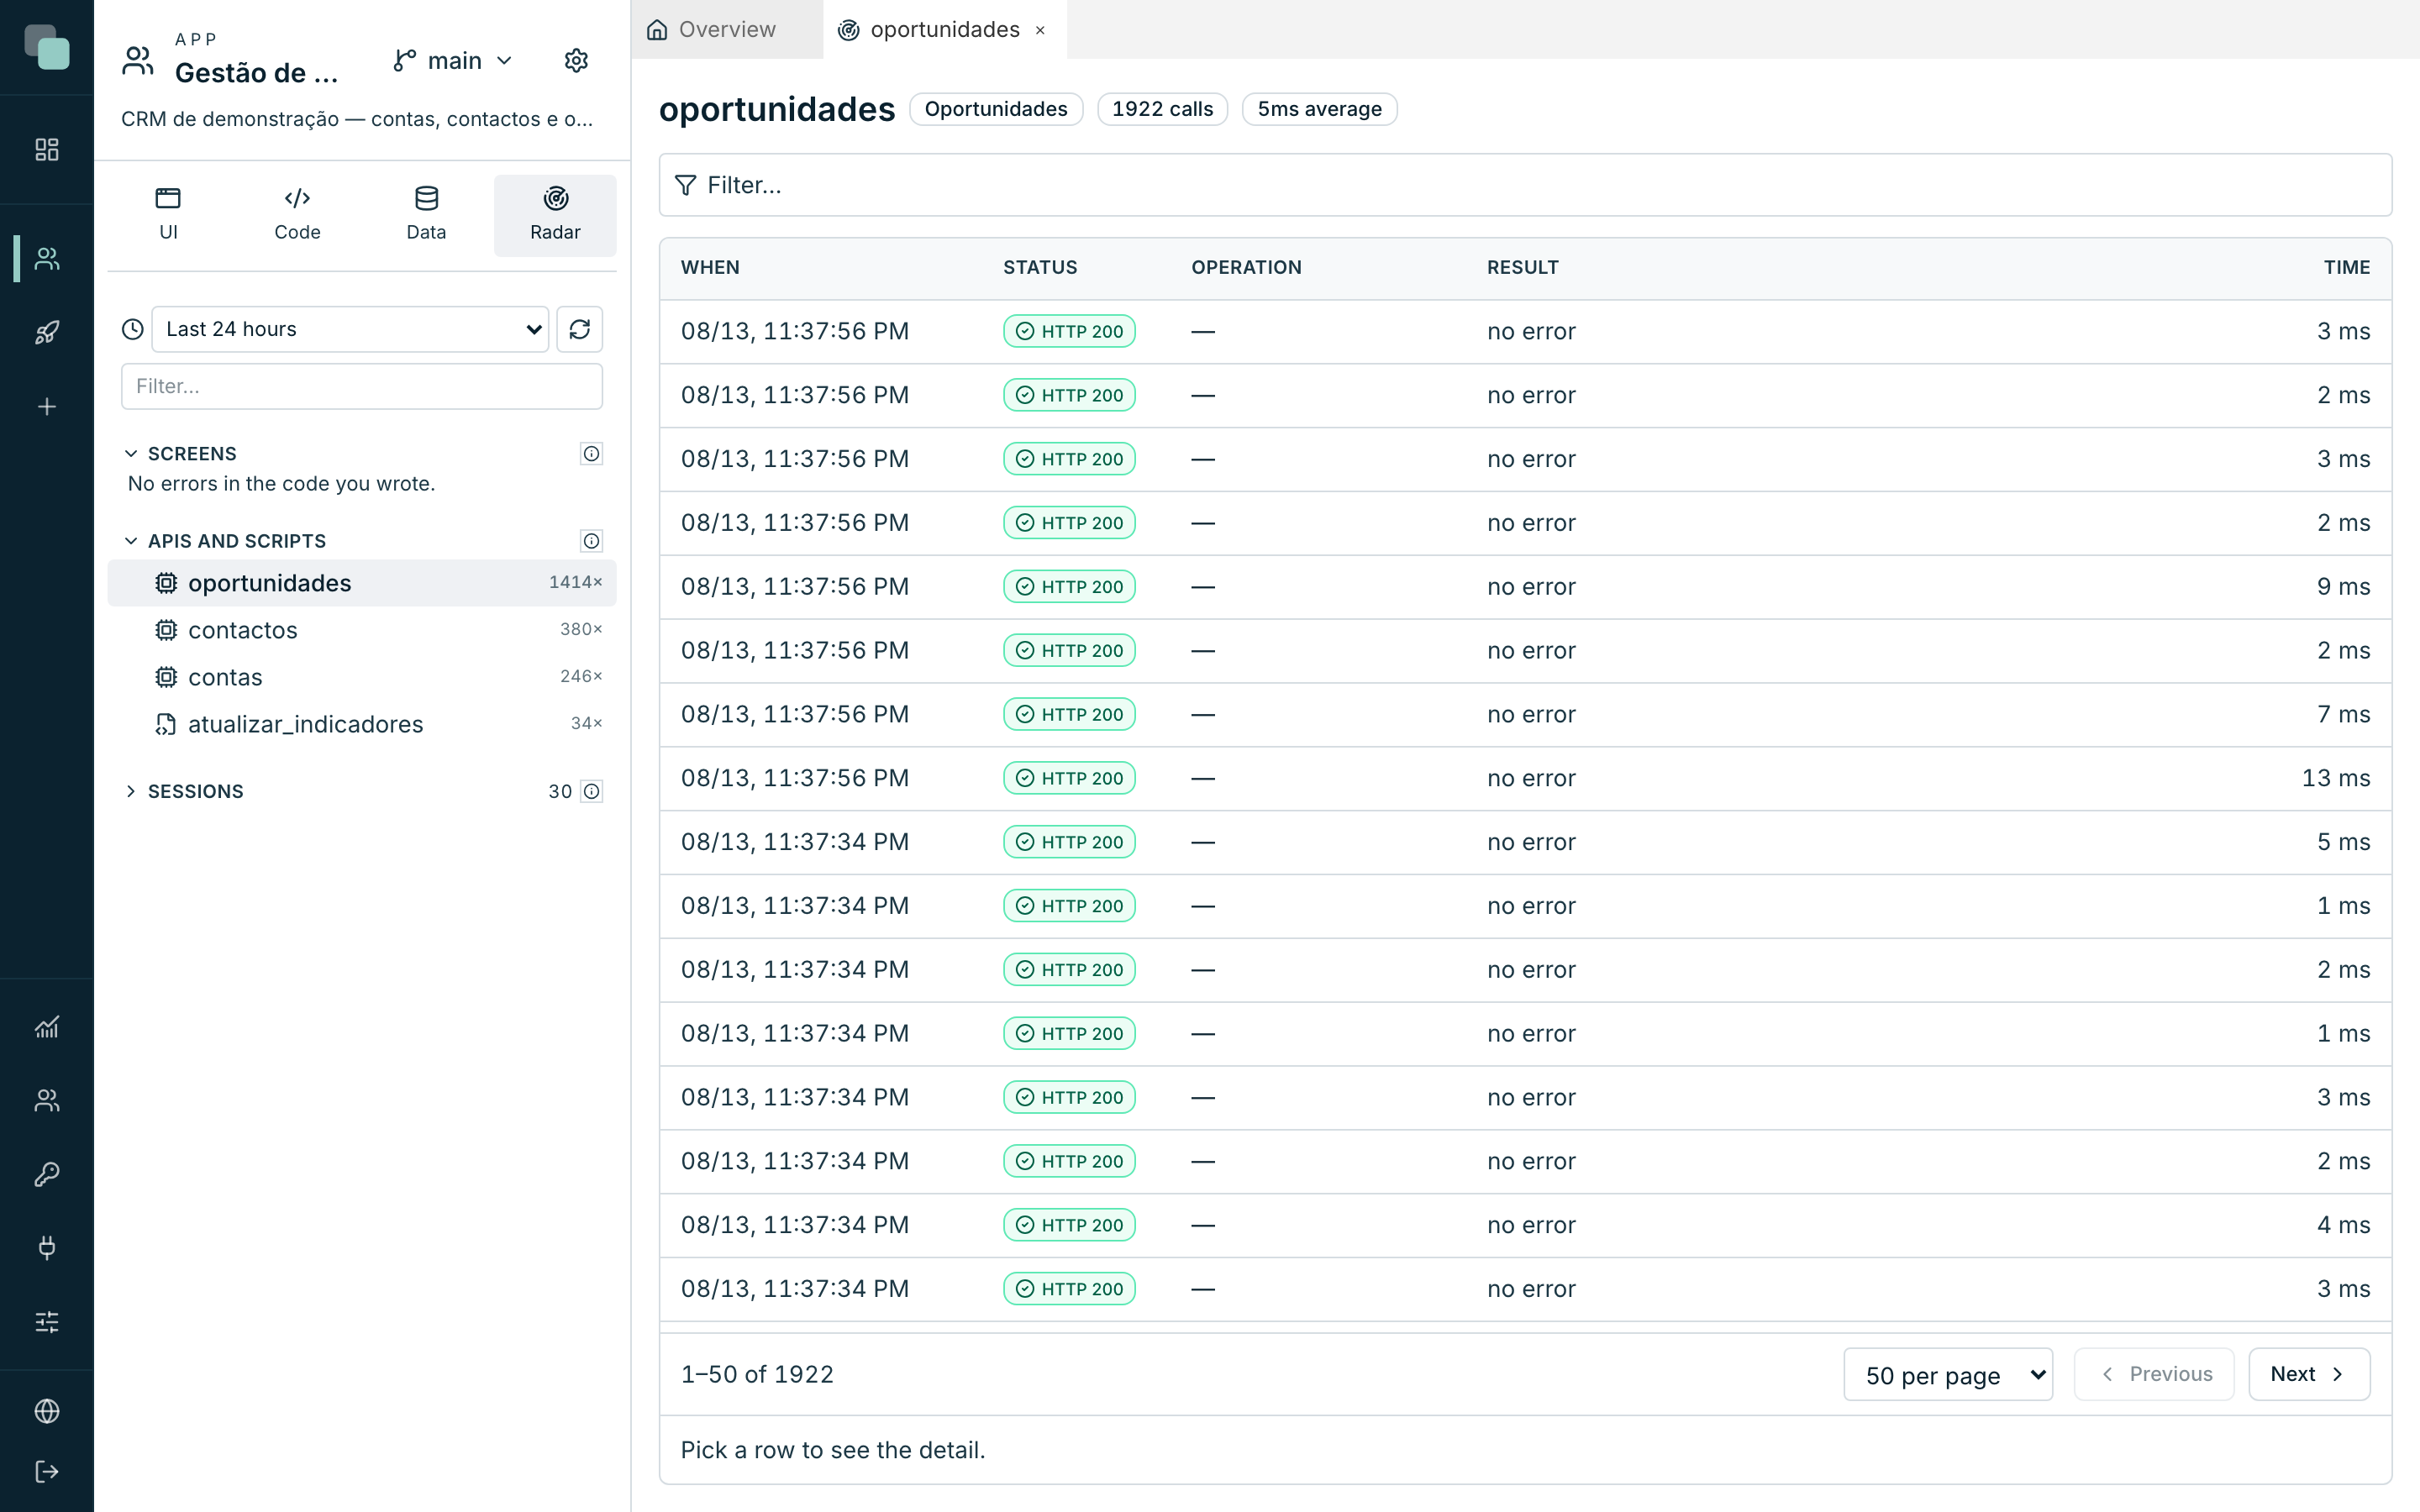
The table has one row per call — never grouped — with five columns:
| Column | What it shows |
|---|---|
| When | The moment of the call. |
| Status | The HTTP status returned. |
| Operation | The operation requested, when the call identifies it. |
| Result | no error, or the type of error that blew up. |
| Time | How long it took. |
The Filter… bar above the table narrows the list by any of these
fields: only the failures, only the ones above 500 ms, only today's. The
pagination at the bottom says where you are — 1–50 of 116.
The detail of a call
Click a row and the detail panel opens below, with three tabs:
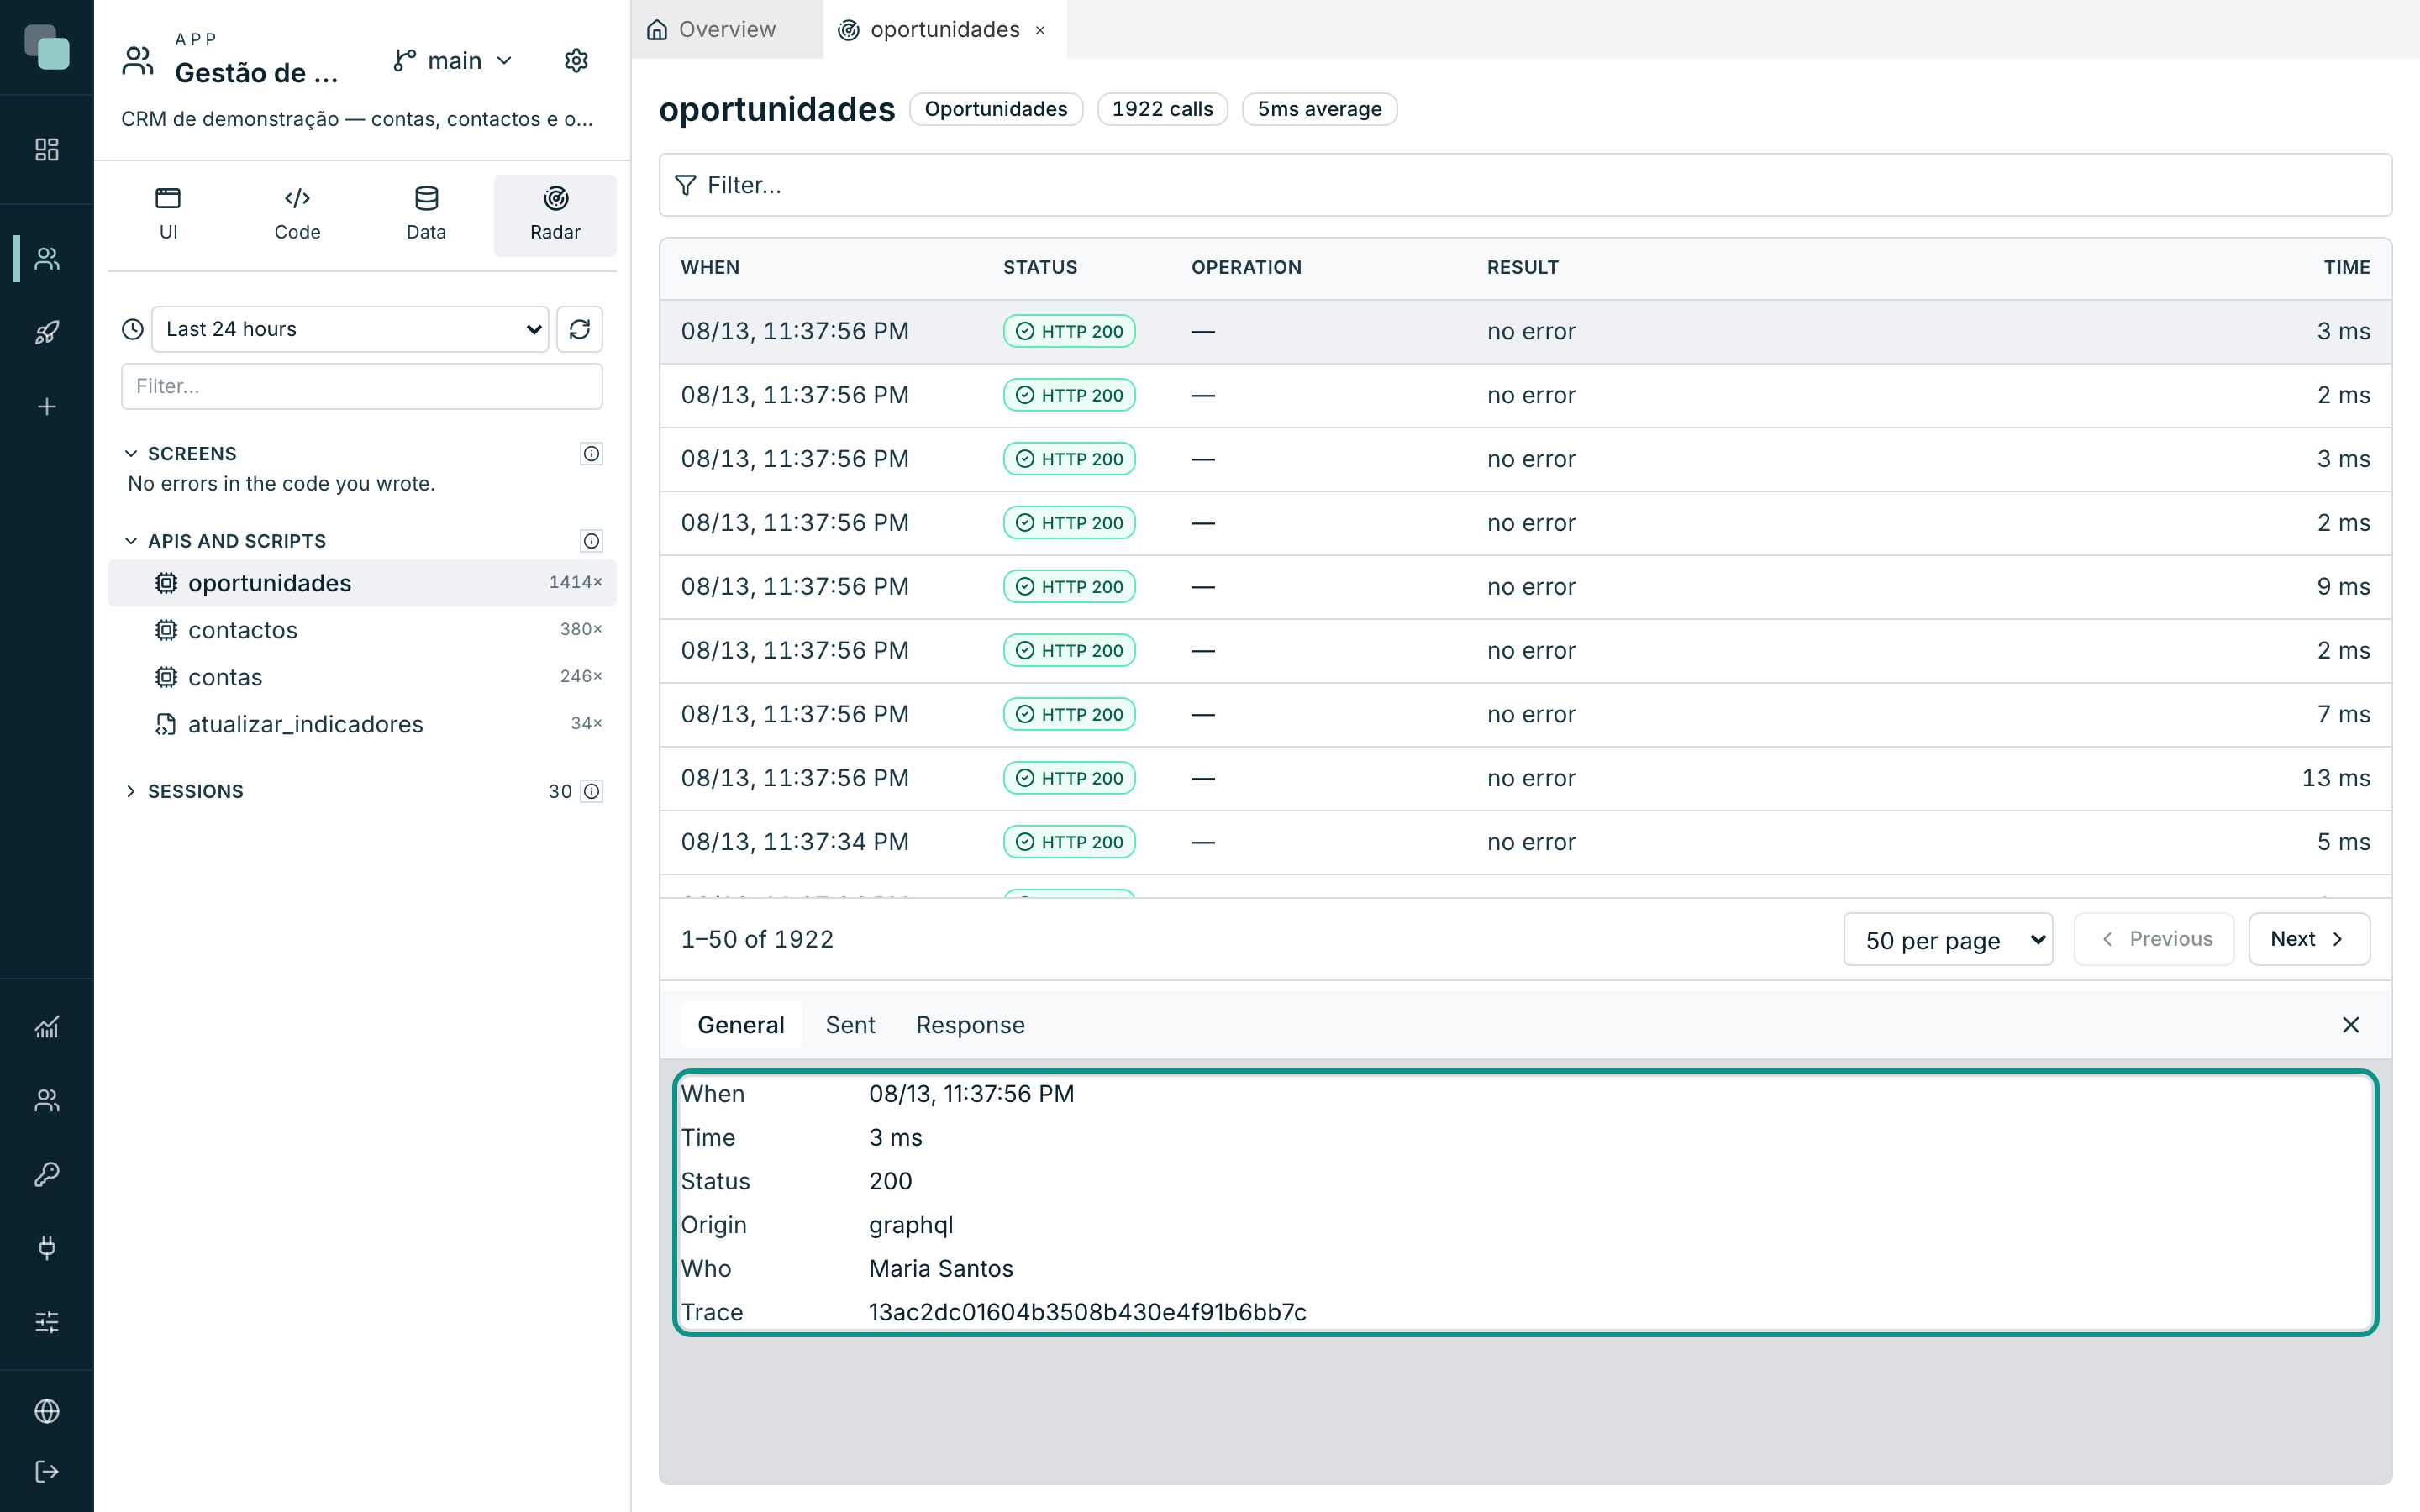
| Tab | What it brings |
|---|---|
| General | When, Time, Status, Origin, who made the call and the Trace that identifies it. |
| Sent | What the call carried. When types are in doubt, it shows, field by field, the Sent value and the Expected type, with the suspect in red. |
| Response | What came back. A call that returned nothing says "Nothing came back."; one that carried nothing says "This call carried nothing." |
Tip
The Trace is the thread that ties everything together. The same reference appears in the Observability events and in the error's detail — copy it and you have the whole journey of a request, even when it went through several pieces.
The scripts have a twin panel: one row per run, with the Exit code, the Trigger that fired it and the Console — the output the script wrote. A script with no runs in the period says "No runs recorded."
The timeline of a session
An isolated call rarely explains an error. The next question is always "what was the person doing?" — and that is what the sessions are for.
- In Radar, expand the Sessions section.
- Click the visit that interests you —
23:11 · demo. - The panel opens with who came in, when, and a summary: 15 steps across 5 pages.
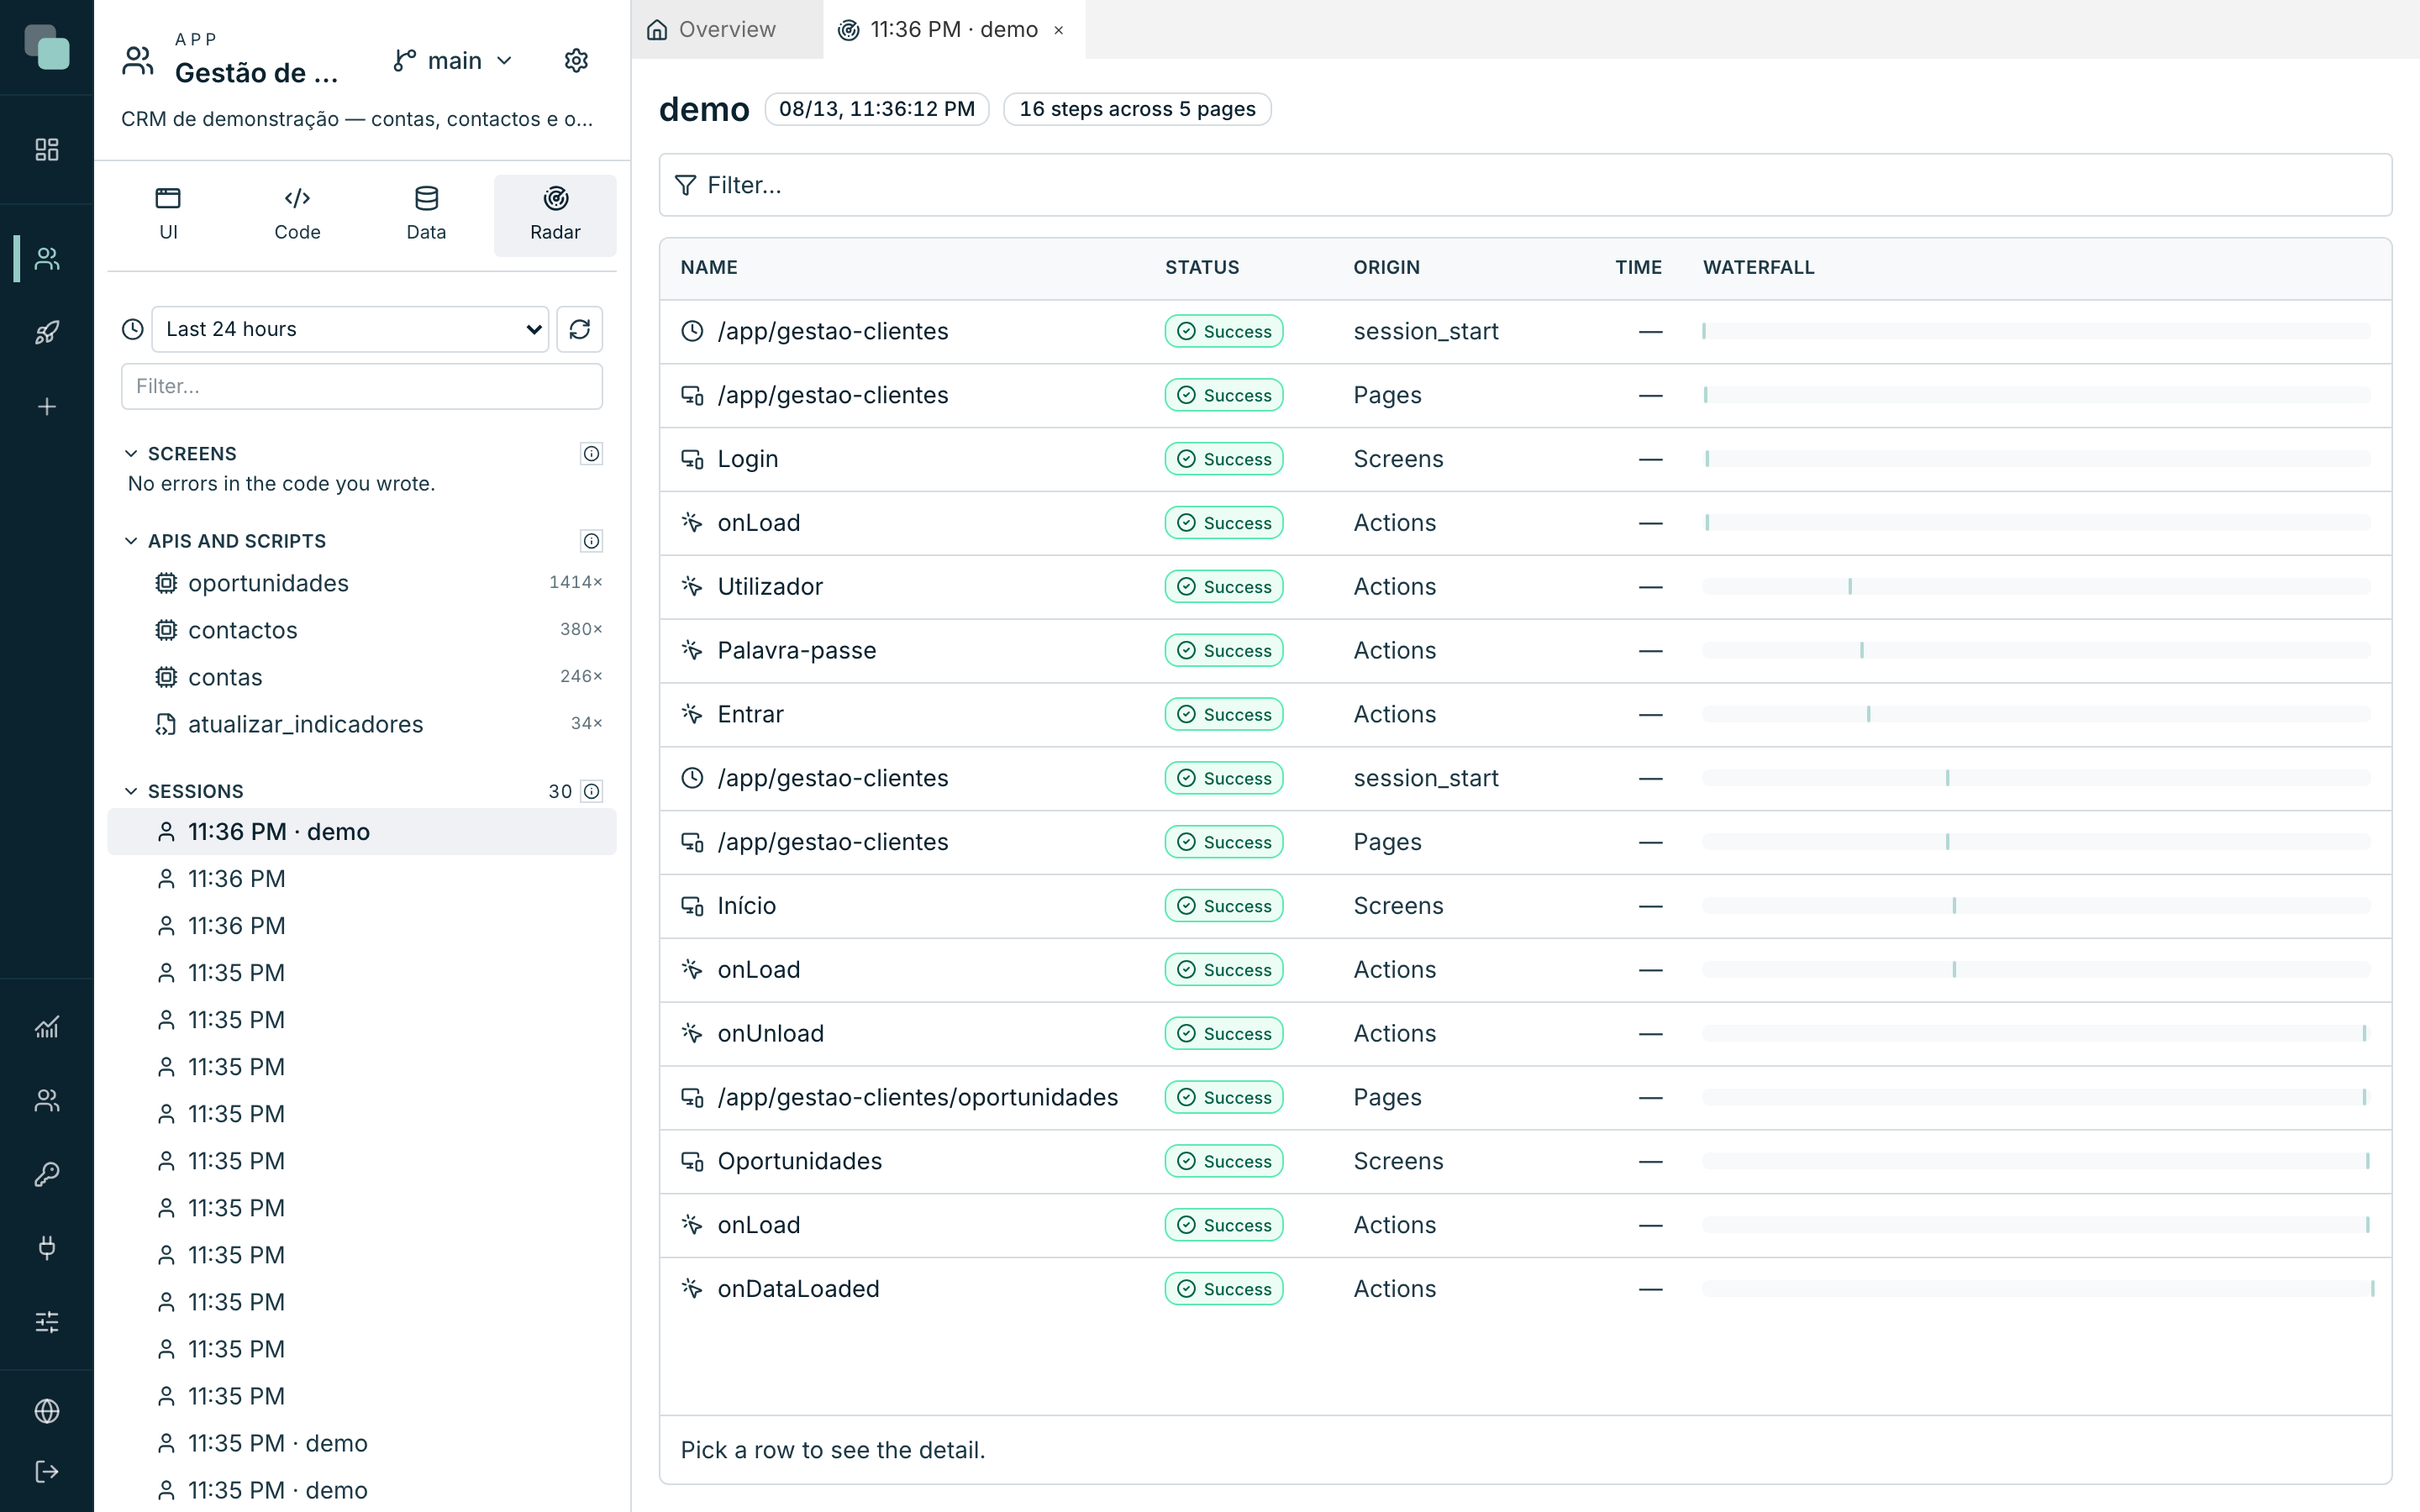
The table is the timeline of the visit, one step per row:
| Column | What it shows |
|---|---|
| Name | The step: a page, a screen, an event, a call to an API, a data read. |
| Status | Whether it went well or badly. |
| Origin | Where the step came from — Pages, Screens, Actions, Data. |
| Time | How long it took. |
| Waterfall | The bar that shows when it happened within the session and how much it took up. |
The waterfall is what makes the reading immediate: the bars line up in
time, and a step that took long is seen without reading a single number.
Click a row for the detail — with Page, When, Time and Since
session start (+0.0s, +2.4s, …). A step that did not call the server
says so: "This step did not call the server."
Note
An empty session — "No steps in this session." — is usually a visit that opened the app and left before anything happened. It is not an error.
A code error
The errors born in the code of the events appear in the Screens section, grouped by cause: one issue per distinct error, with the number of occurrences beside it.
Click one to open the issue's panel, which gathers everything that is known about it:
| Zone | What it answers |
|---|---|
| Code | The excerpt of your code, with the guilty line highlighted, and the exact Position. |
| Path to here | What the person did before it blew up — page, screen, data reads, the final click. |
| Error trace | The technical trace, when it was kept. |
| Flow | The error's journey through the pieces of the app. |
| Open in designer | Takes you straight to the event where the error was born. |
The Open in designer button is the natural end of the investigation: you found the line, now you are going to fix it.
An error the platform classified as From the platform shows something else: "This error came from the Keplin runtime, not from your app code. There is nothing to fix on your side — worth reporting it." — with a Reference to copy.
The issues, across every app
The Observability → Issues menu is the same matter, gathered and with a state. Each row is a grouped issue, with Occurrences, Affected users, First seen and Last seen.
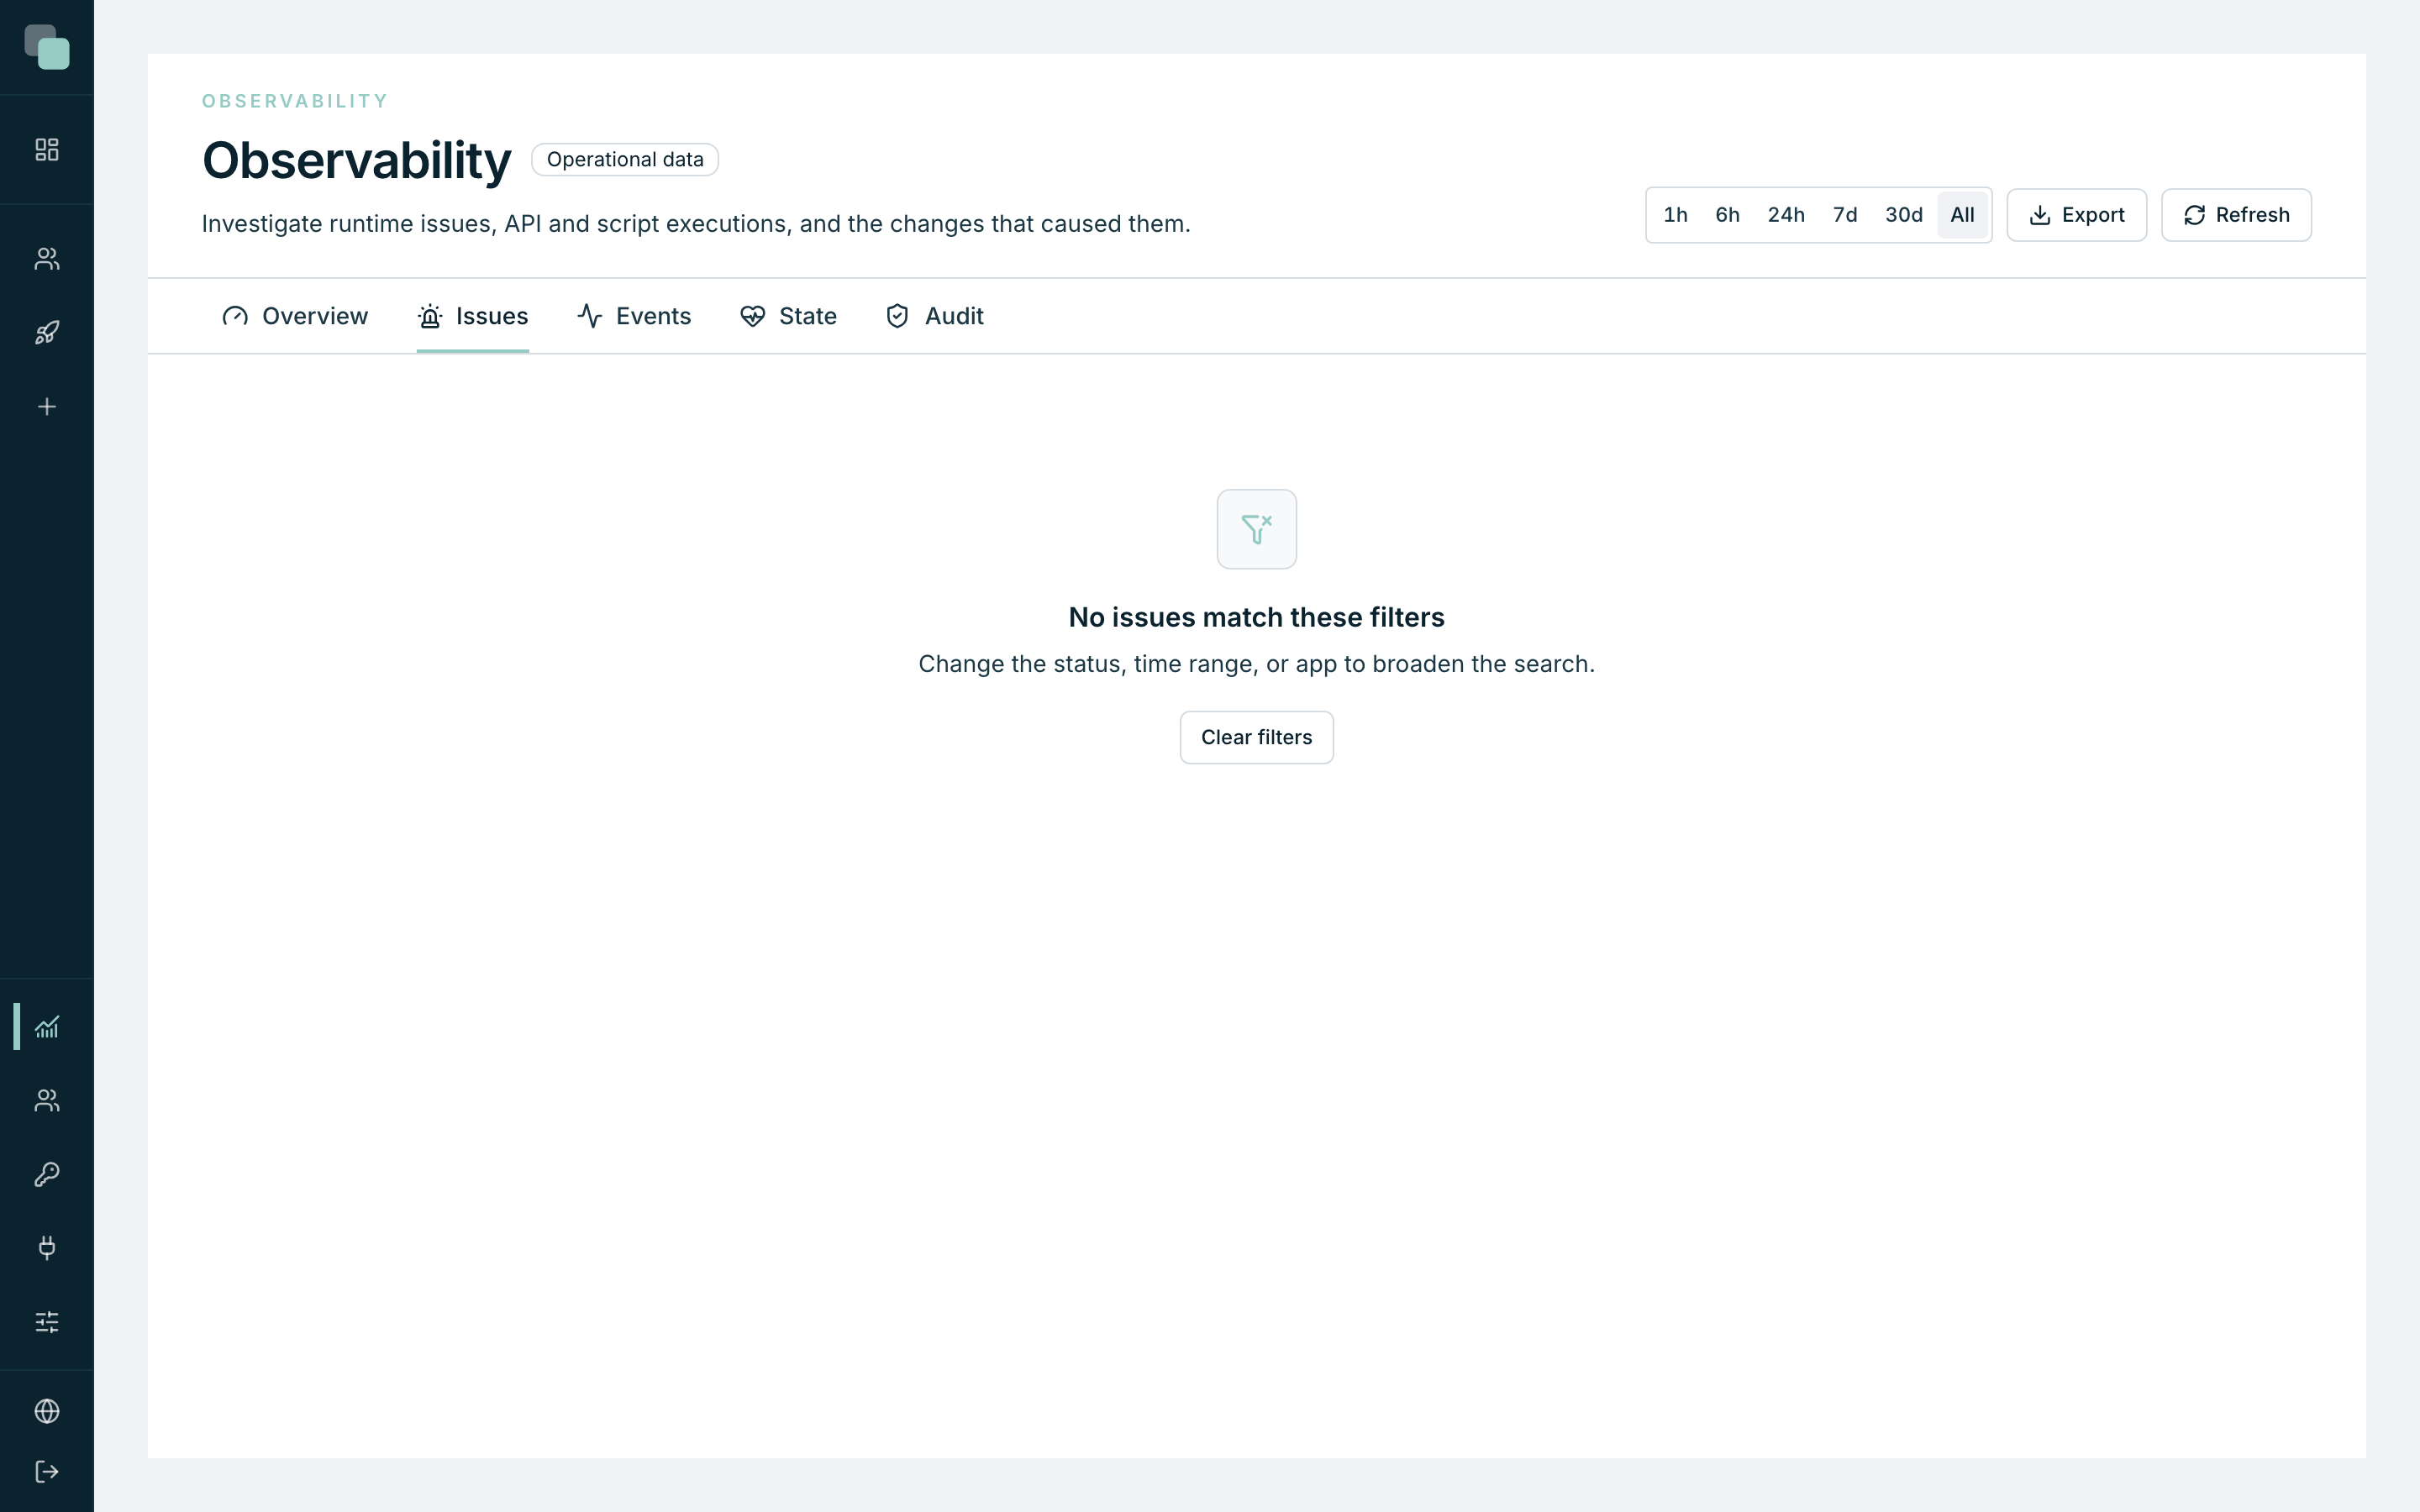
A healthy installation has this page empty — "No issues match these filters", with Clear filters to widen the search. Before concluding that there are no issues, check the period at the top: with 1h chosen, an error from yesterday does not show.
Each issue has three states, and they are changed in the panel itself:
| Action | What it does |
|---|---|
| Resolve | Marks it as dealt with — "Issue marked as resolved." If it happens again, it reopens by itself. |
| Ignore | Takes it out of the way without resolving it — "Issue ignored." For the noise you know about. |
| Reopen | Returns it to open — "Issue reopened." |
Inside an issue, the Issue chain draws the journey: the context in the browser, the correlated executions, the error and the observed impact. When there is no way to link the pieces, it says so instead of making things up — "Dashed links only show confirmed context, not an inferred causal relationship."
The events, one by one
Observability → Events is the raw list: one row per API, script or system execution, including the ones that went well.
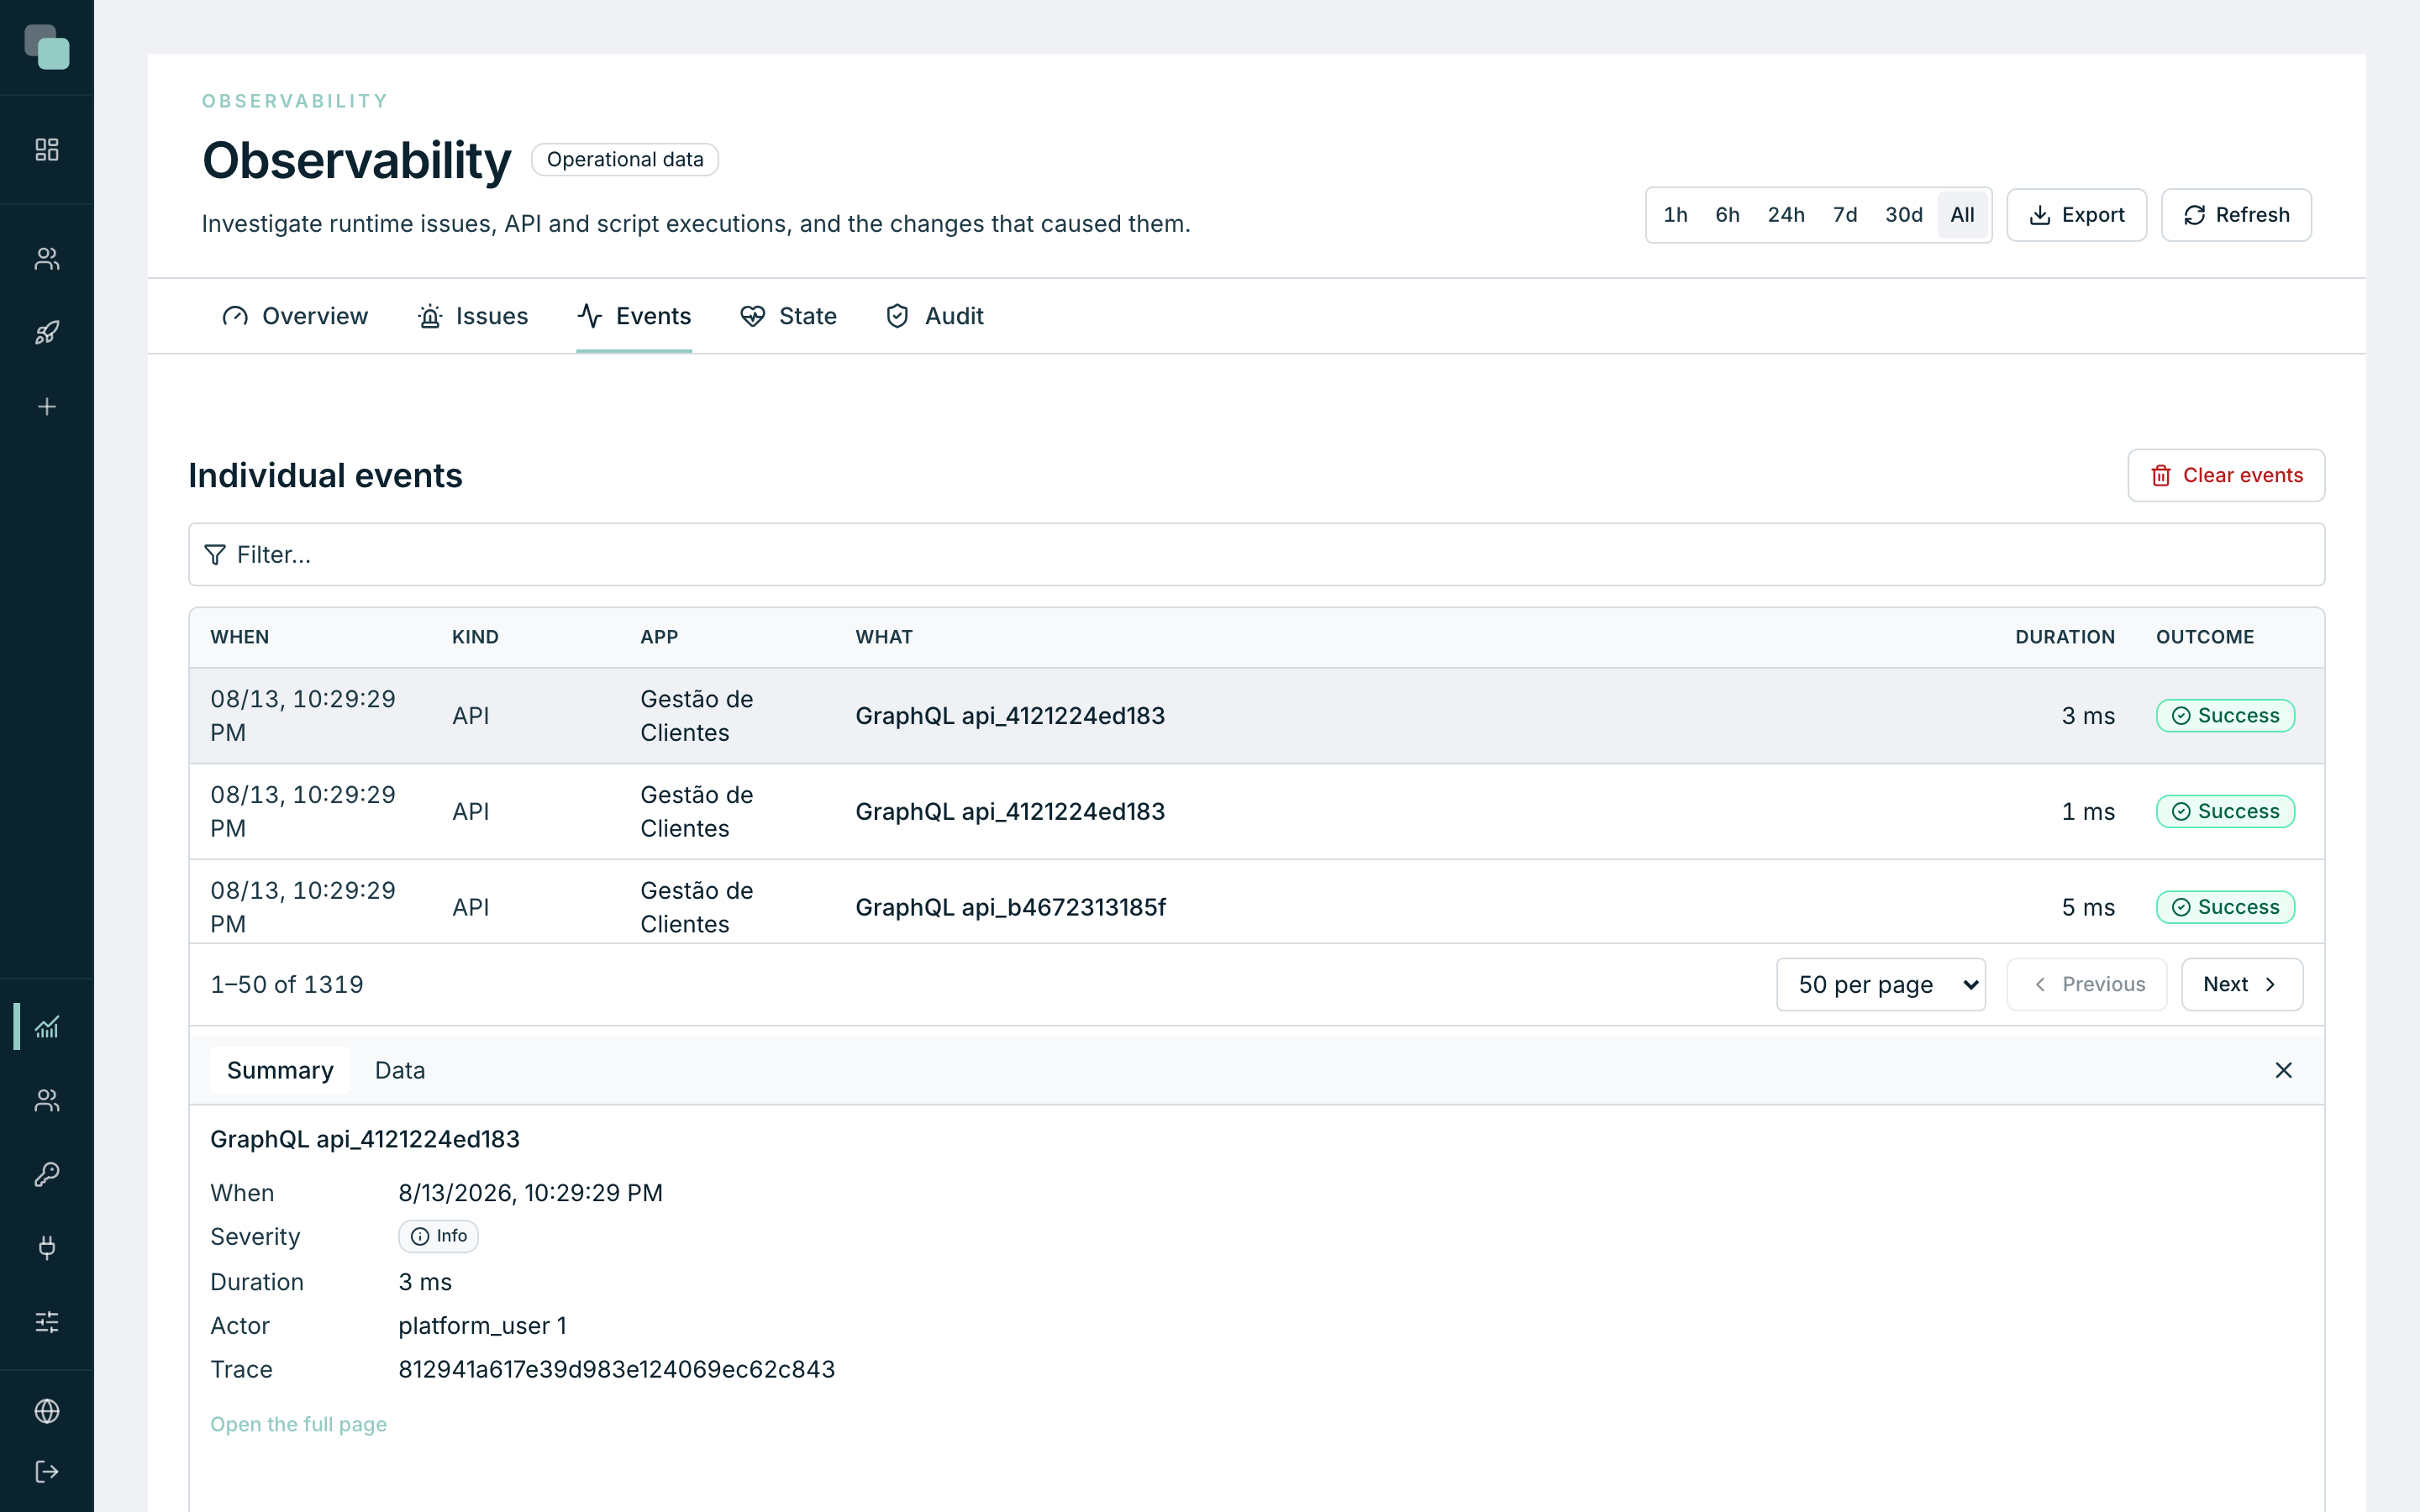
Columns: When, Kind, App, What, Duration and Outcome. The filters at the top cut by App, Type, Status, Severity and period; Clear filters resets everything.
Click a row and the detail opens beside it, with Summary and Data — and Open the full page when you need more room. Error messages appear in the server's original language, on purpose: translating them would pull them away from the text you search the documentation for.
And why now? The audit
An error that started today almost always has a change behind it. Observability → Audit keeps the administrative and configuration changes — create, alter, delete, execute, import, export, revoke, reset password, update role — with who made them, in which app and when.
Click a row and the detail shows the Before and the After of the change. It is the direct answer to the question that closes most investigations: "what changed yesterday afternoon?"
The route, in short
- Overview — which app is on fire.
- The app's Radar — which API, script or screen.
- Its panel — which call, with what data, at what moment.
- The session — what the person did before.
- The issue — the line of code and the Open in designer button.
- The Audit — what changed for this to start.
Why don't I see…?
- …the detail of a call? No row is selected. The table says "Pick a row to see the detail."
- …the occurrences of an old issue? They may have been taken by record rotation — the panel warns you when that happens.
- …the Path to here filled in? Not every occurrence carries the route; when it does not, the panel says "No path recorded for this occurrence." instead of showing invented steps.
- …the Open in designer button? It only appears on errors that originated in the app's code. Platform errors have nothing to open.