What the Radar measures
Each app's Radar minitab, the tree of Screens, APIs and scripts and Sessions, the time window, and the Observability that gathers every app.
The Radar is the app seen from the inside, while it is being used. It is not a report you run at the end of the month: it is what the application is doing now — which APIs were called, how long they took, which screens blew up, which people came in and what they did up to the point where something went wrong.
It exists in two places, and the difference between them is only one of altitude:
| Where | What it answers |
|---|---|
| The Radar minitab, inside an app | "What is going on in this app?" |
| The Observability menu, in the sidebar | "What is going on in every app, and on the platform?" |
The Radar minitab
Open an app in the sidebar and click Radar, the fourth of the app bar's minitabs (after UI, Code and Data). The bar starts showing the Radar tree; the space on the right shows the panel of whatever you choose.
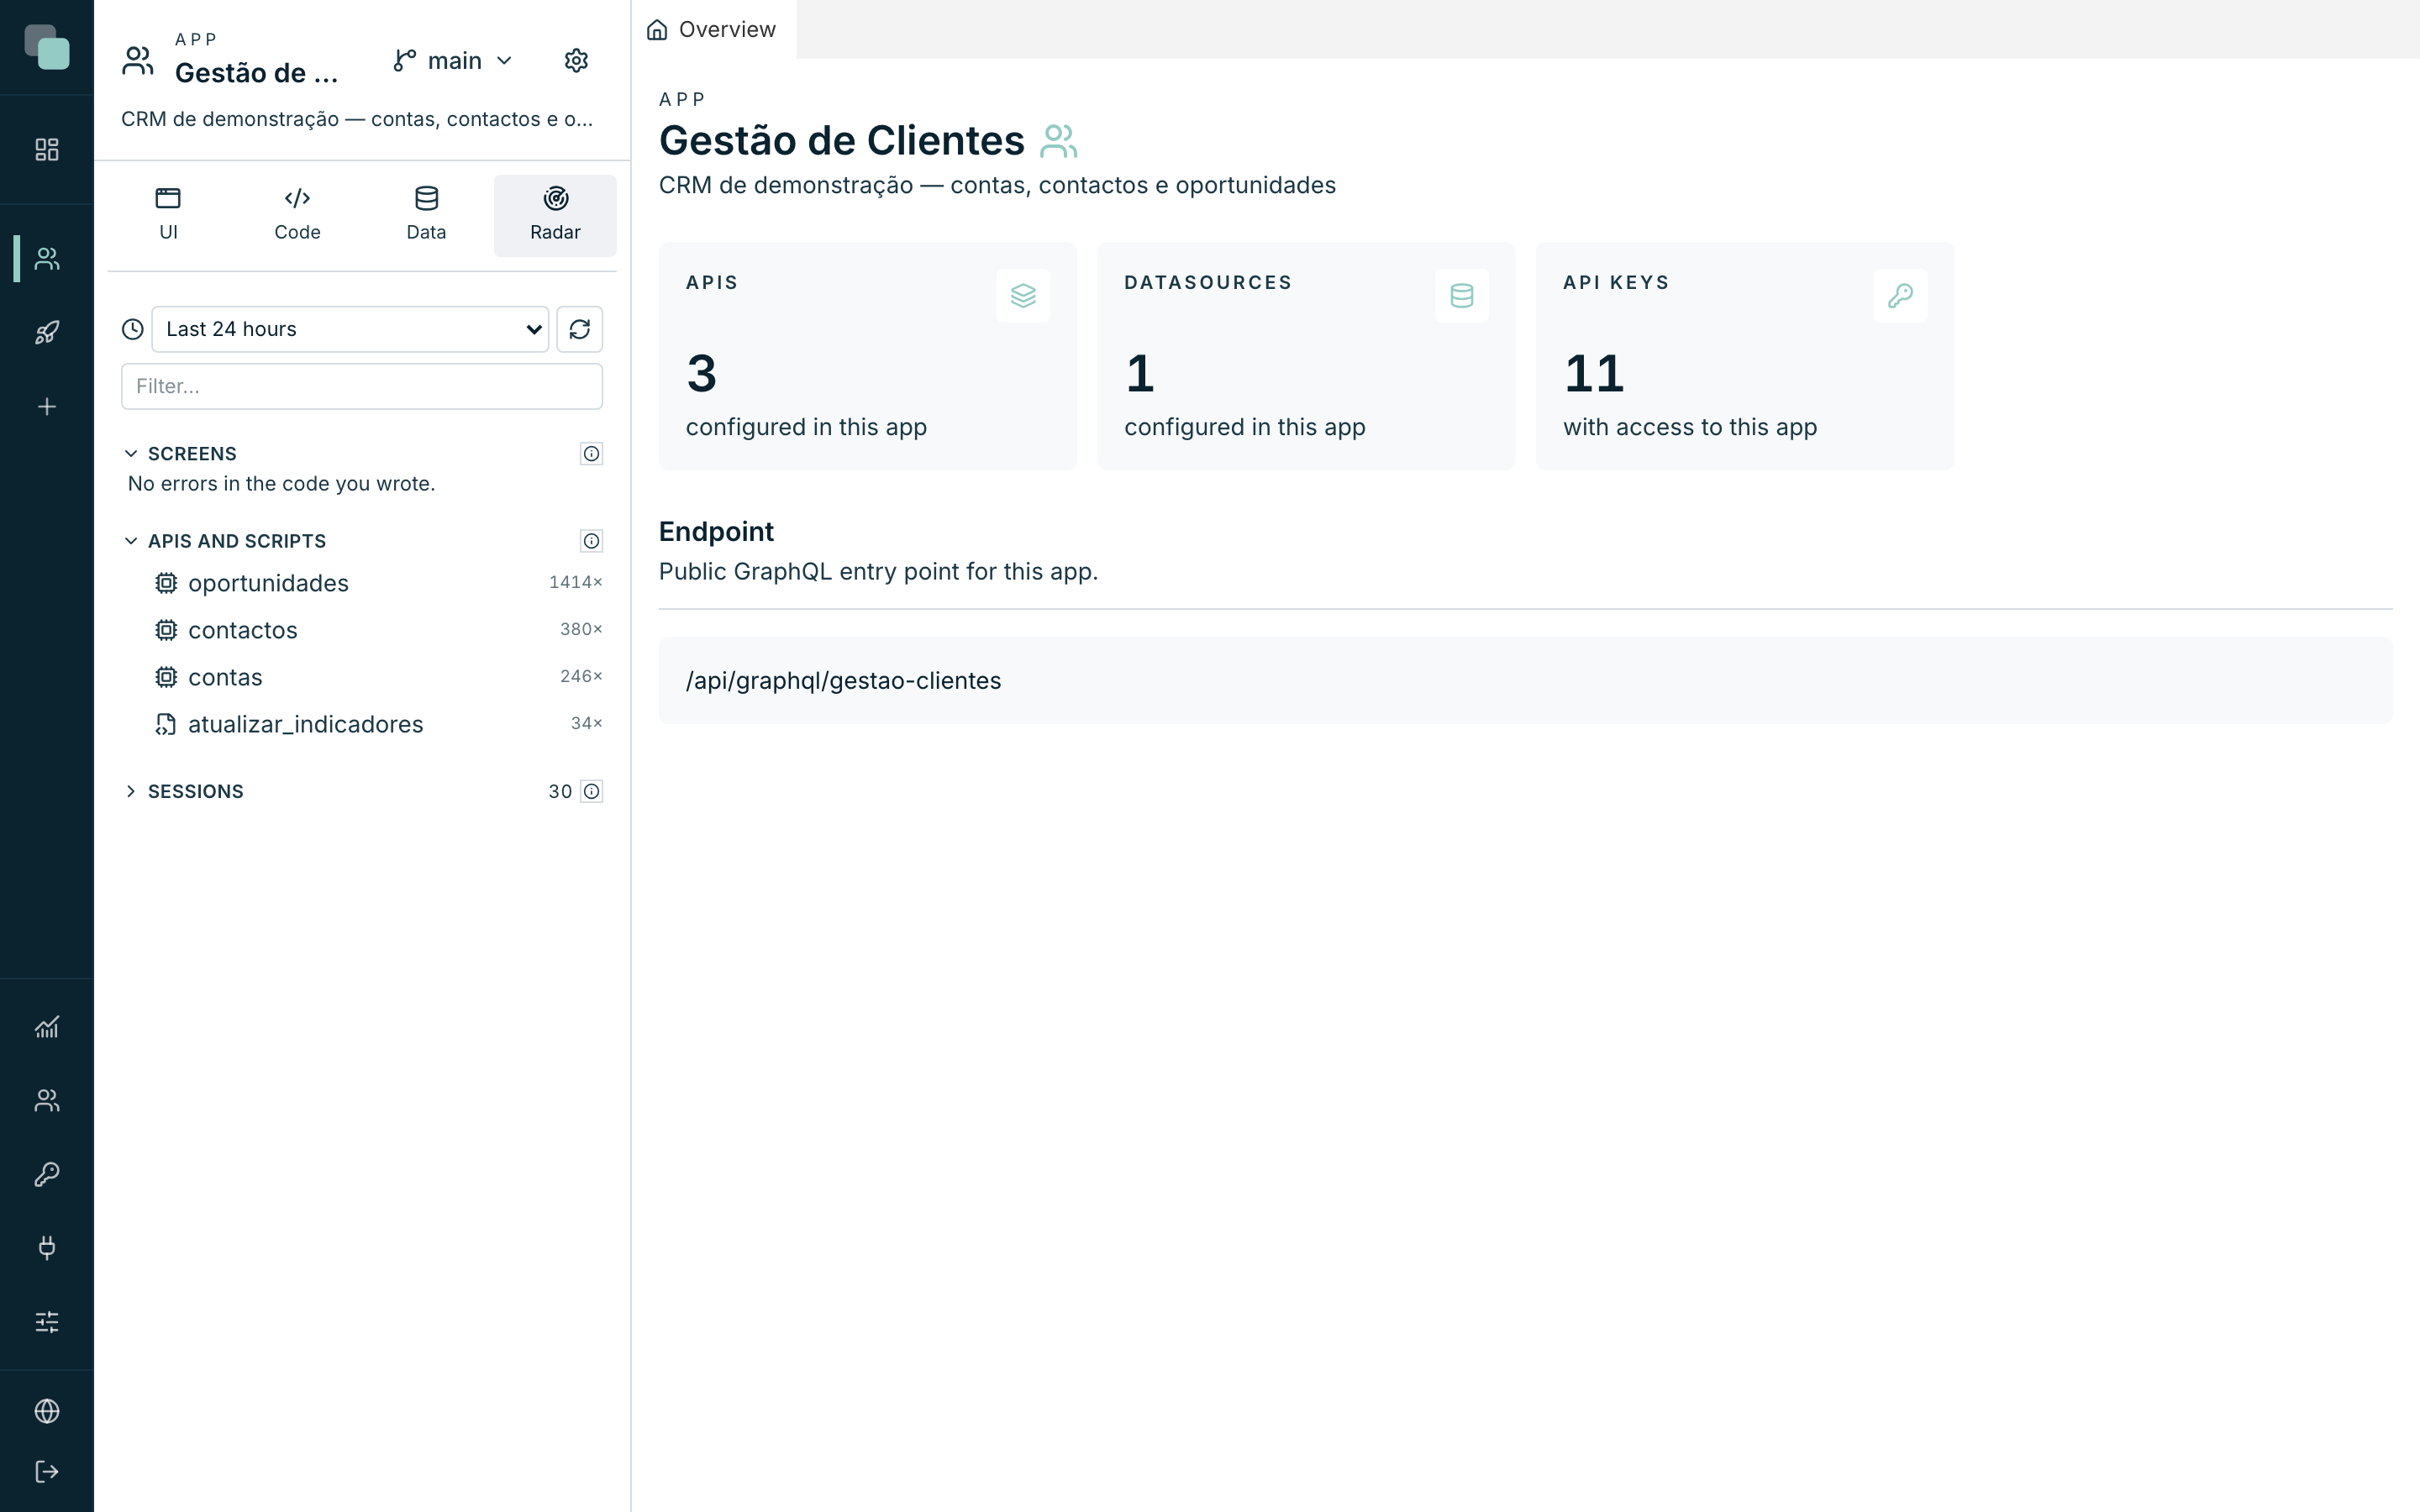
At the top of the tree there are two controls that apply to everything below:
- The period selector — Last hour, Last 24 hours, Last 7 days or All. It is what decides what the tree counts.
- The Refresh button, which re-reads without changing the period.
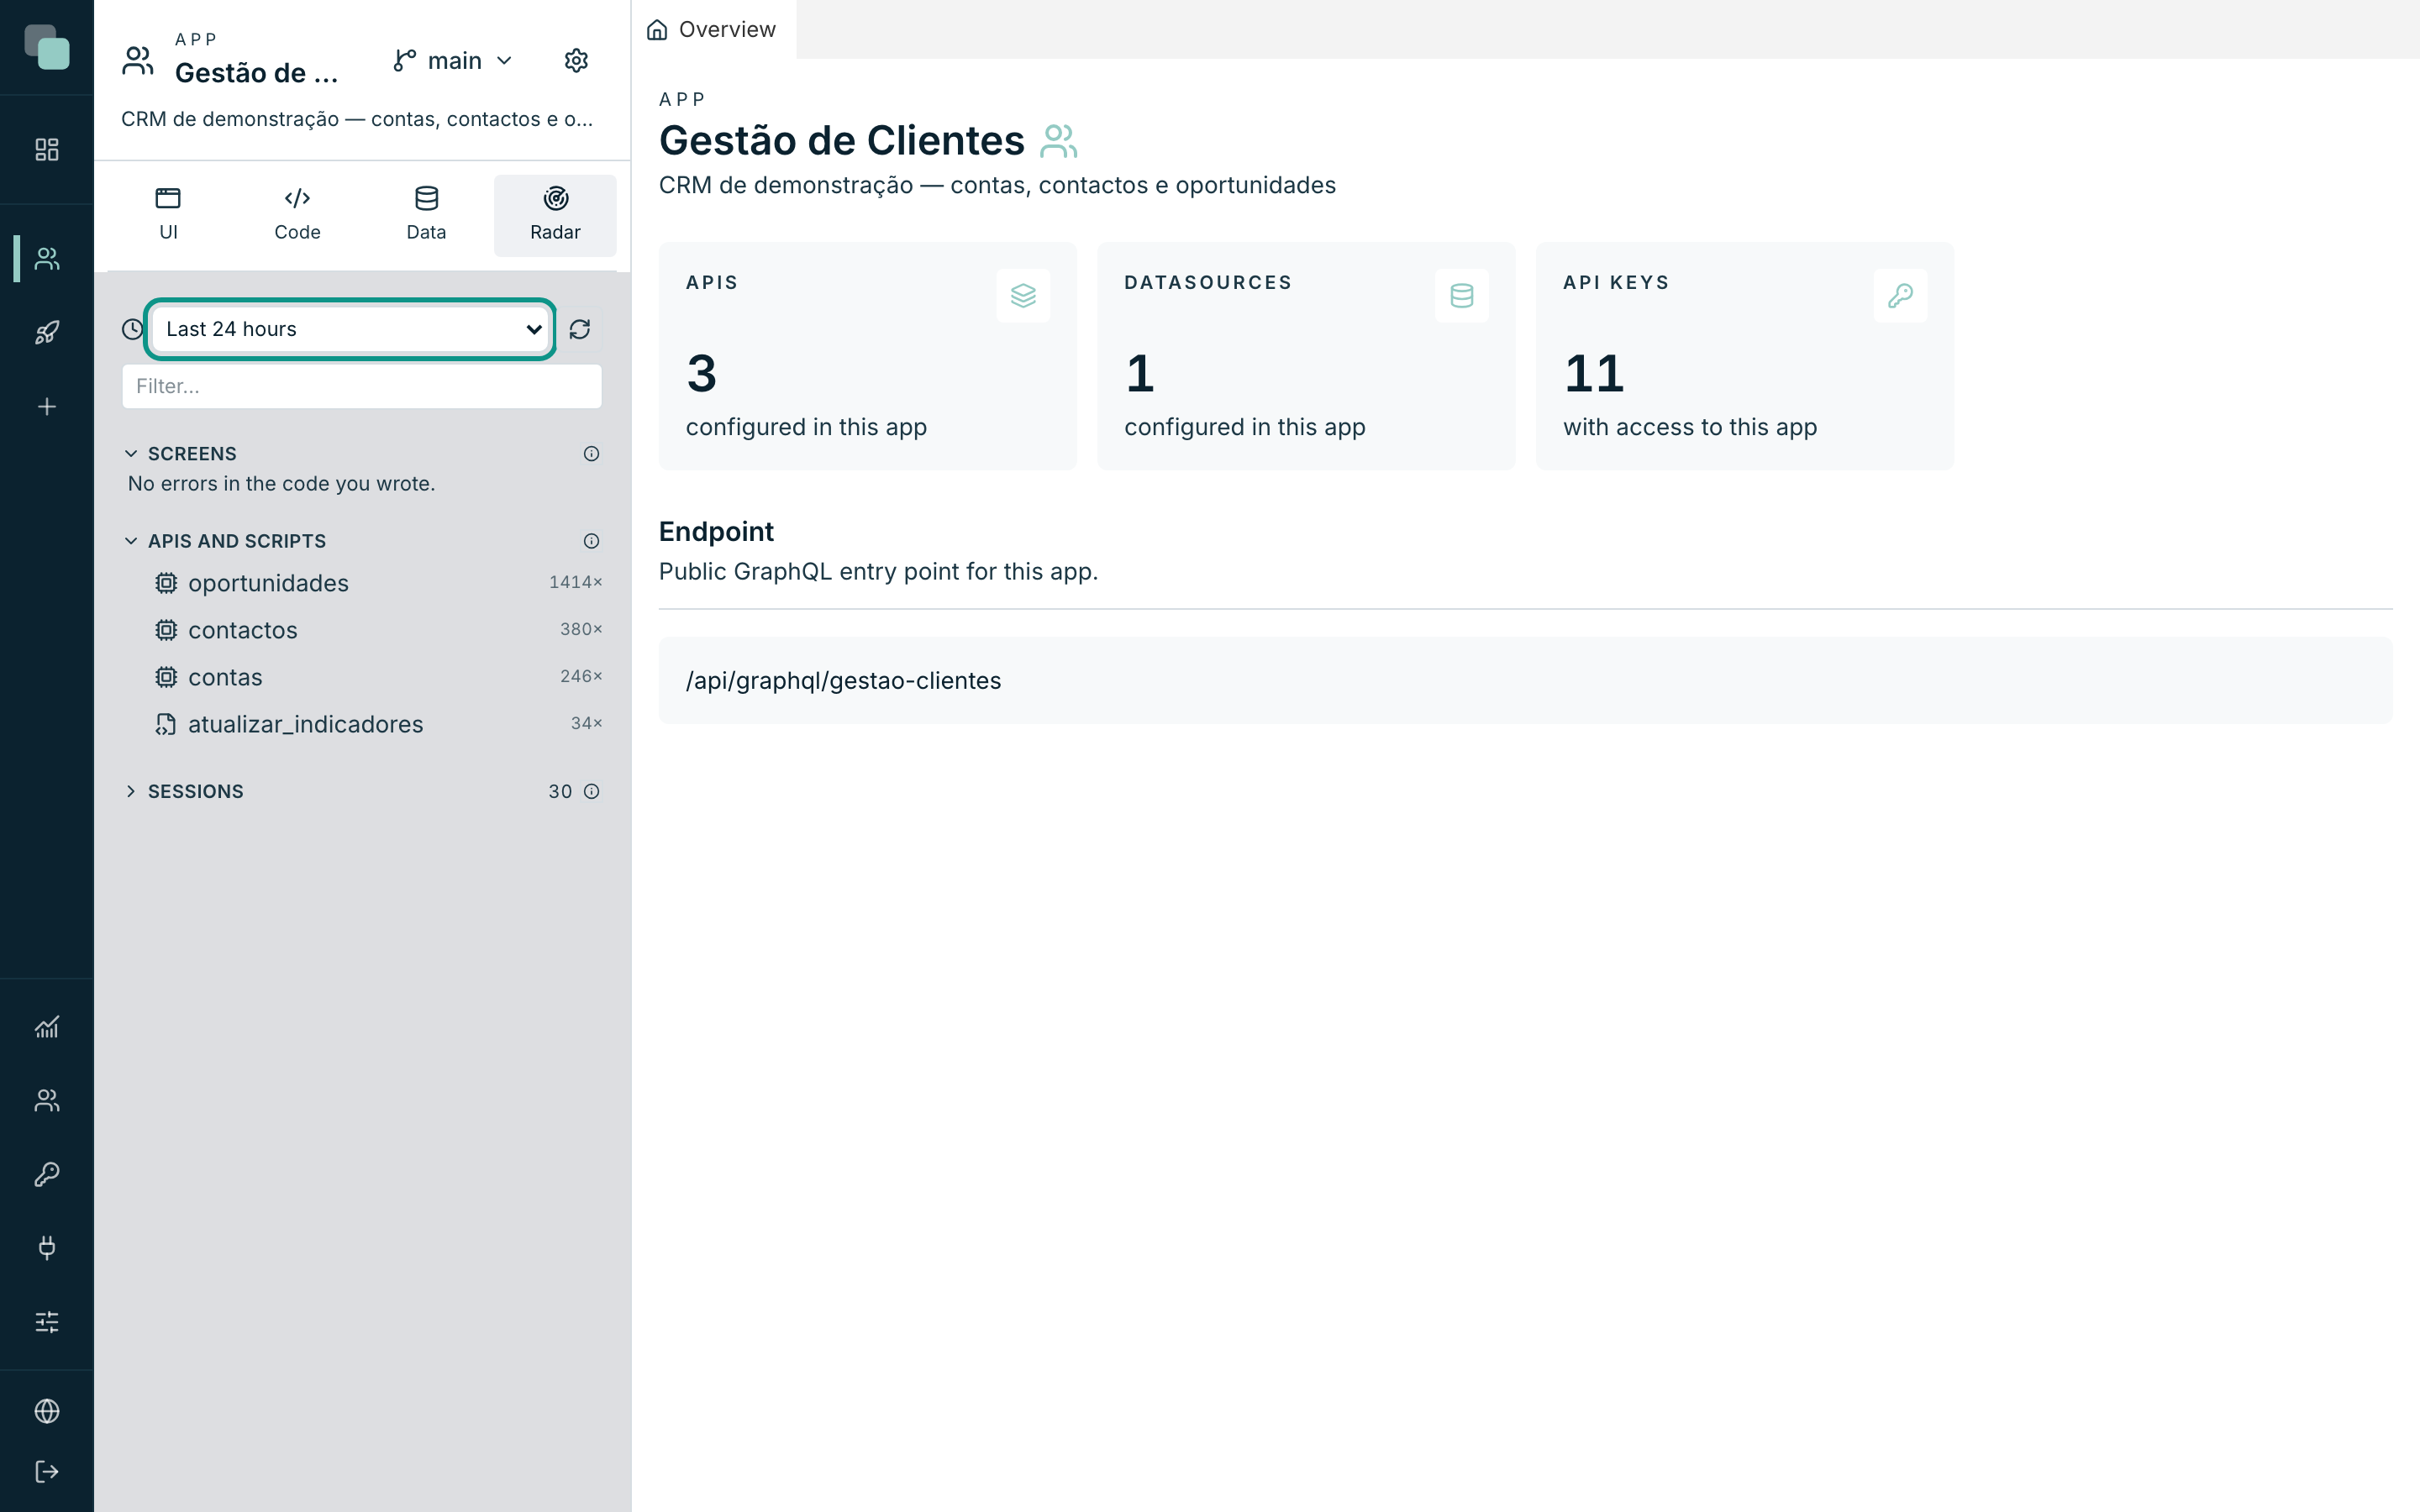
Below them, the Filter… box narrows the tree down to whatever matches what you type.
Note
An empty section always says why. "Nothing in the selected period." is the period pinching, not a fault — widen it to All before concluding there is no data.
The three sections of the tree
Screens
The errors that were born in the code you wrote in the events of the screens and the widgets. It is the section where there is something to fix on your side, and that is why it comes first.
Each row is a screen; open it and you see its errors, grouped by cause, with the number of times they happened. With no errors at all, the section says "No errors in the code you wrote."
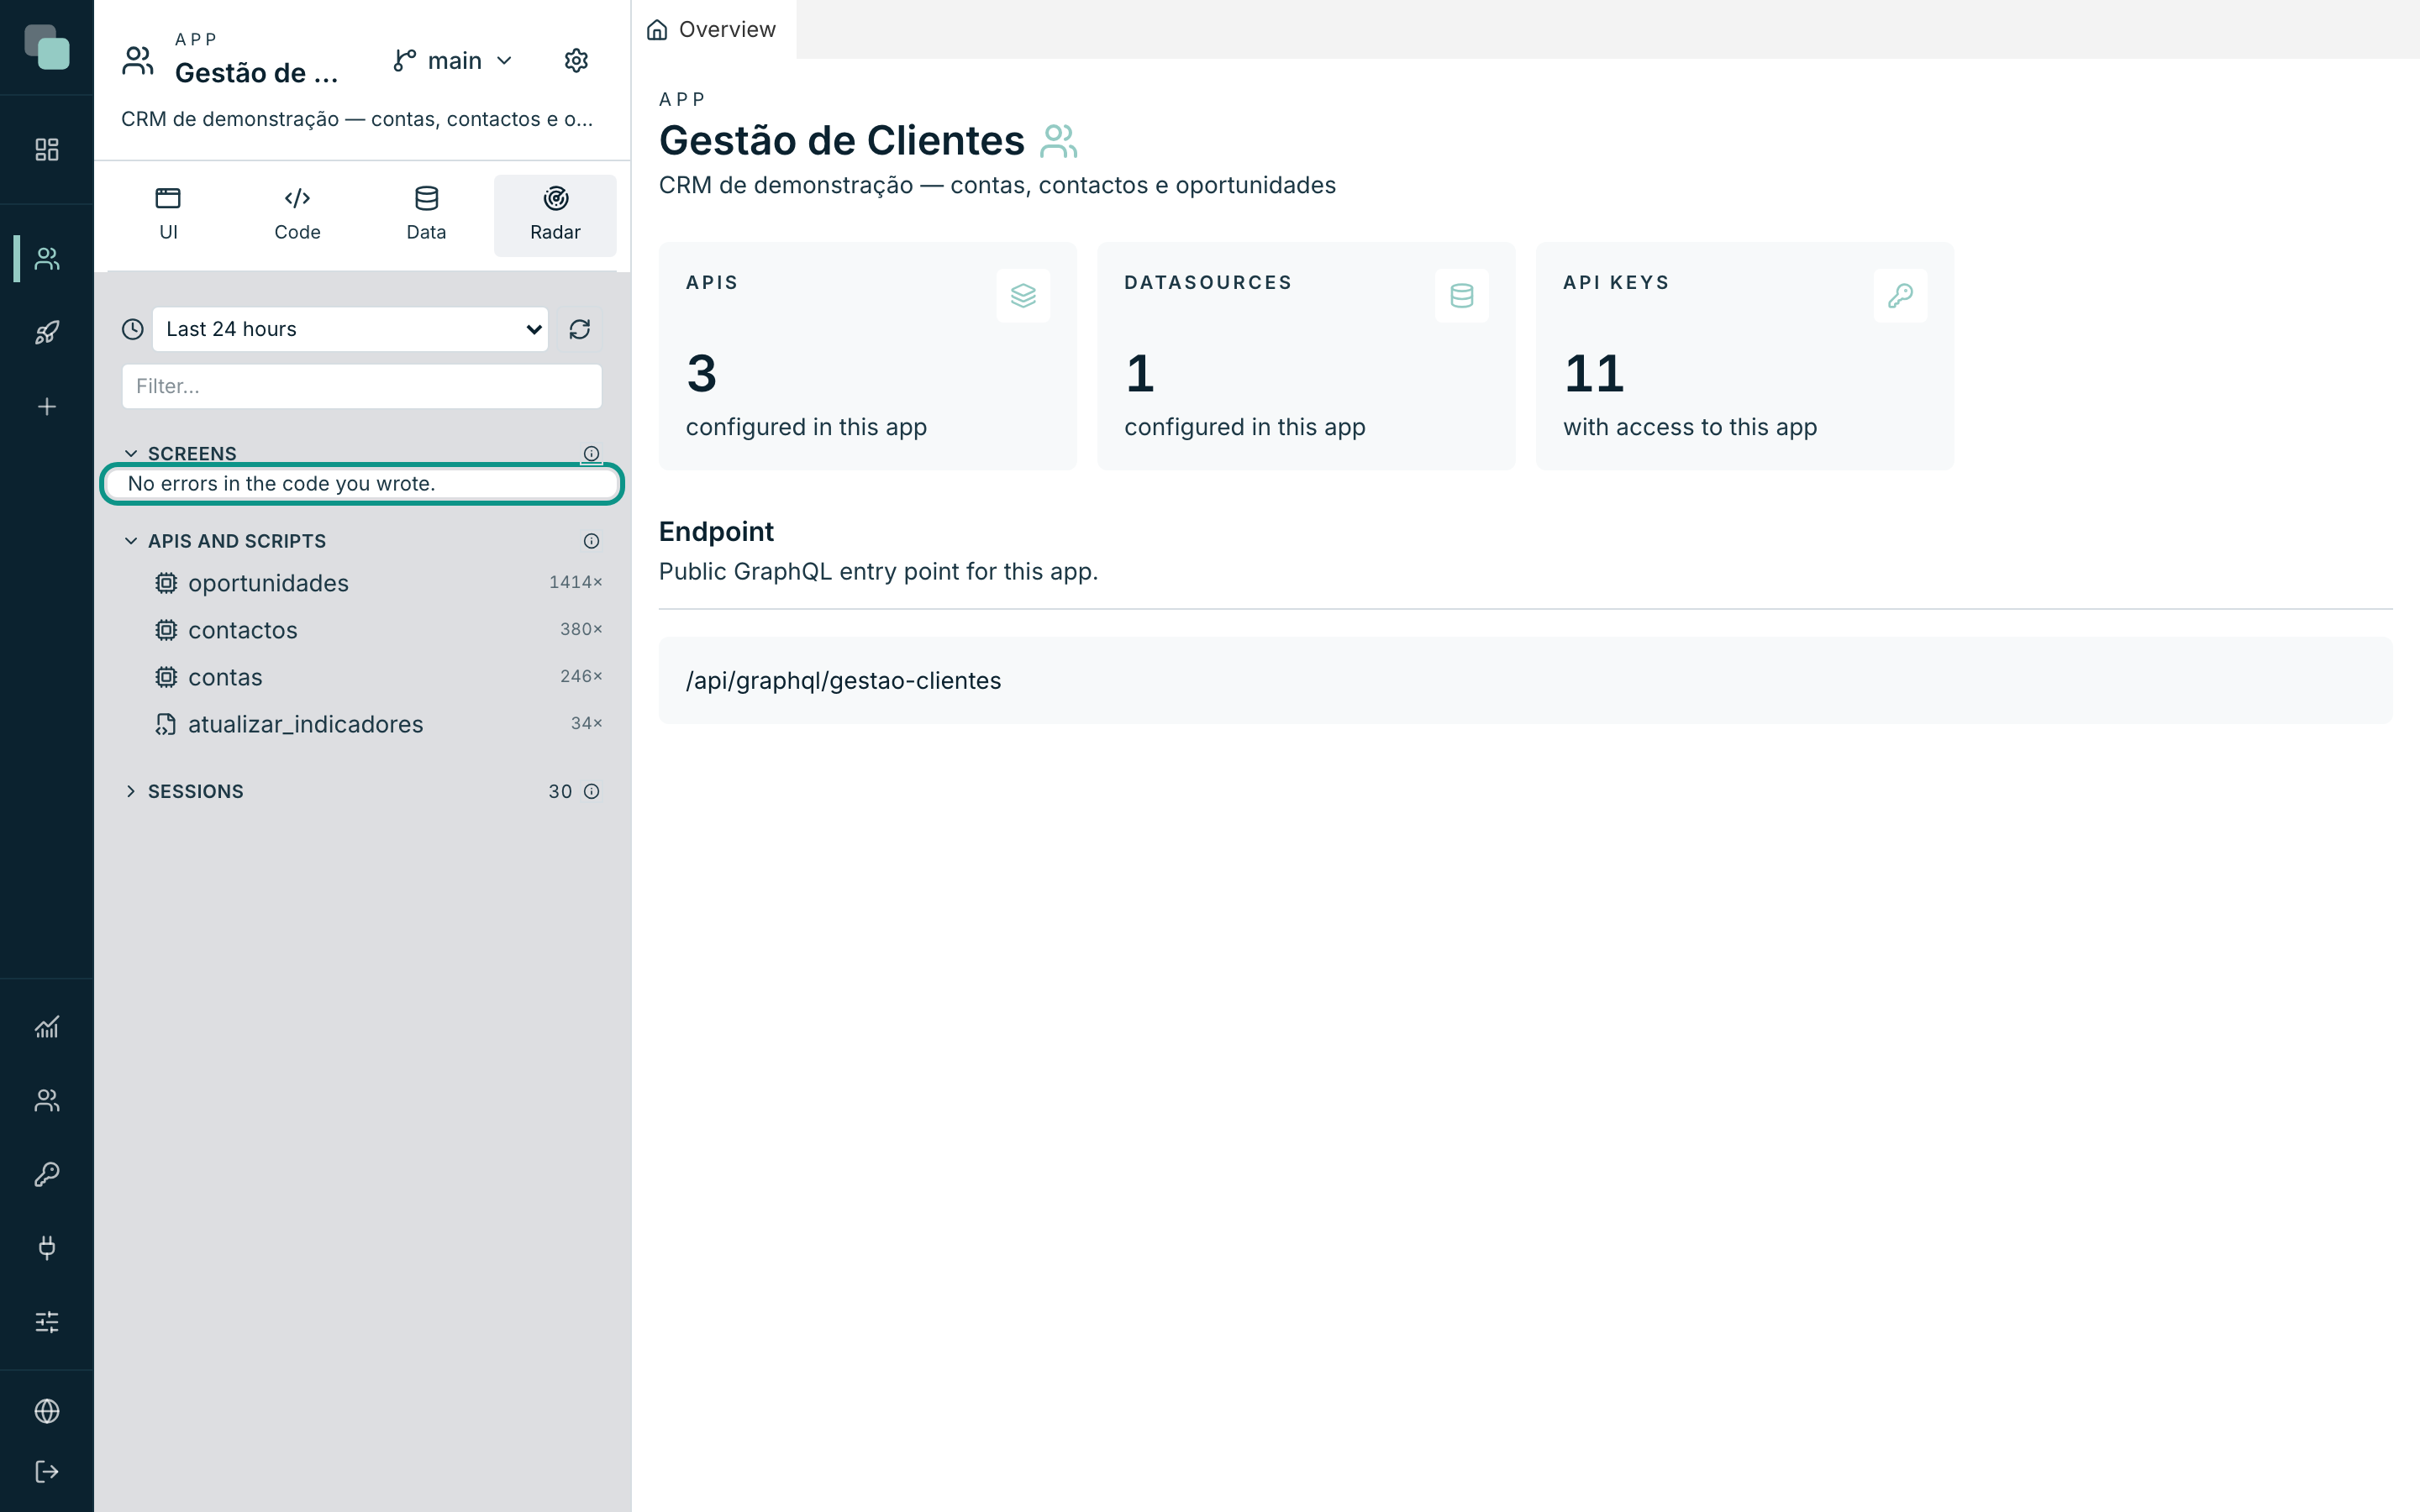
The ⓘ next to the title repeats the criterion: "Errors from the code you wrote in widget and screen events. These you can fix."
APIs and scripts
The calls to the app's APIs and the script runs, with the failures grouped by cause. Each row carries the name and a summary — how many calls, and the average time. A red number at the end of the row is failures.
Click a row to open its panel (it is the subject of the next page of this chapter).
Sessions
Each visit to the app: who came in, when, and what went wrong. The rows are
the sessions, identified by the time and by who came in — 23:11 · demo —,
or by the time alone when the visit was anonymous.
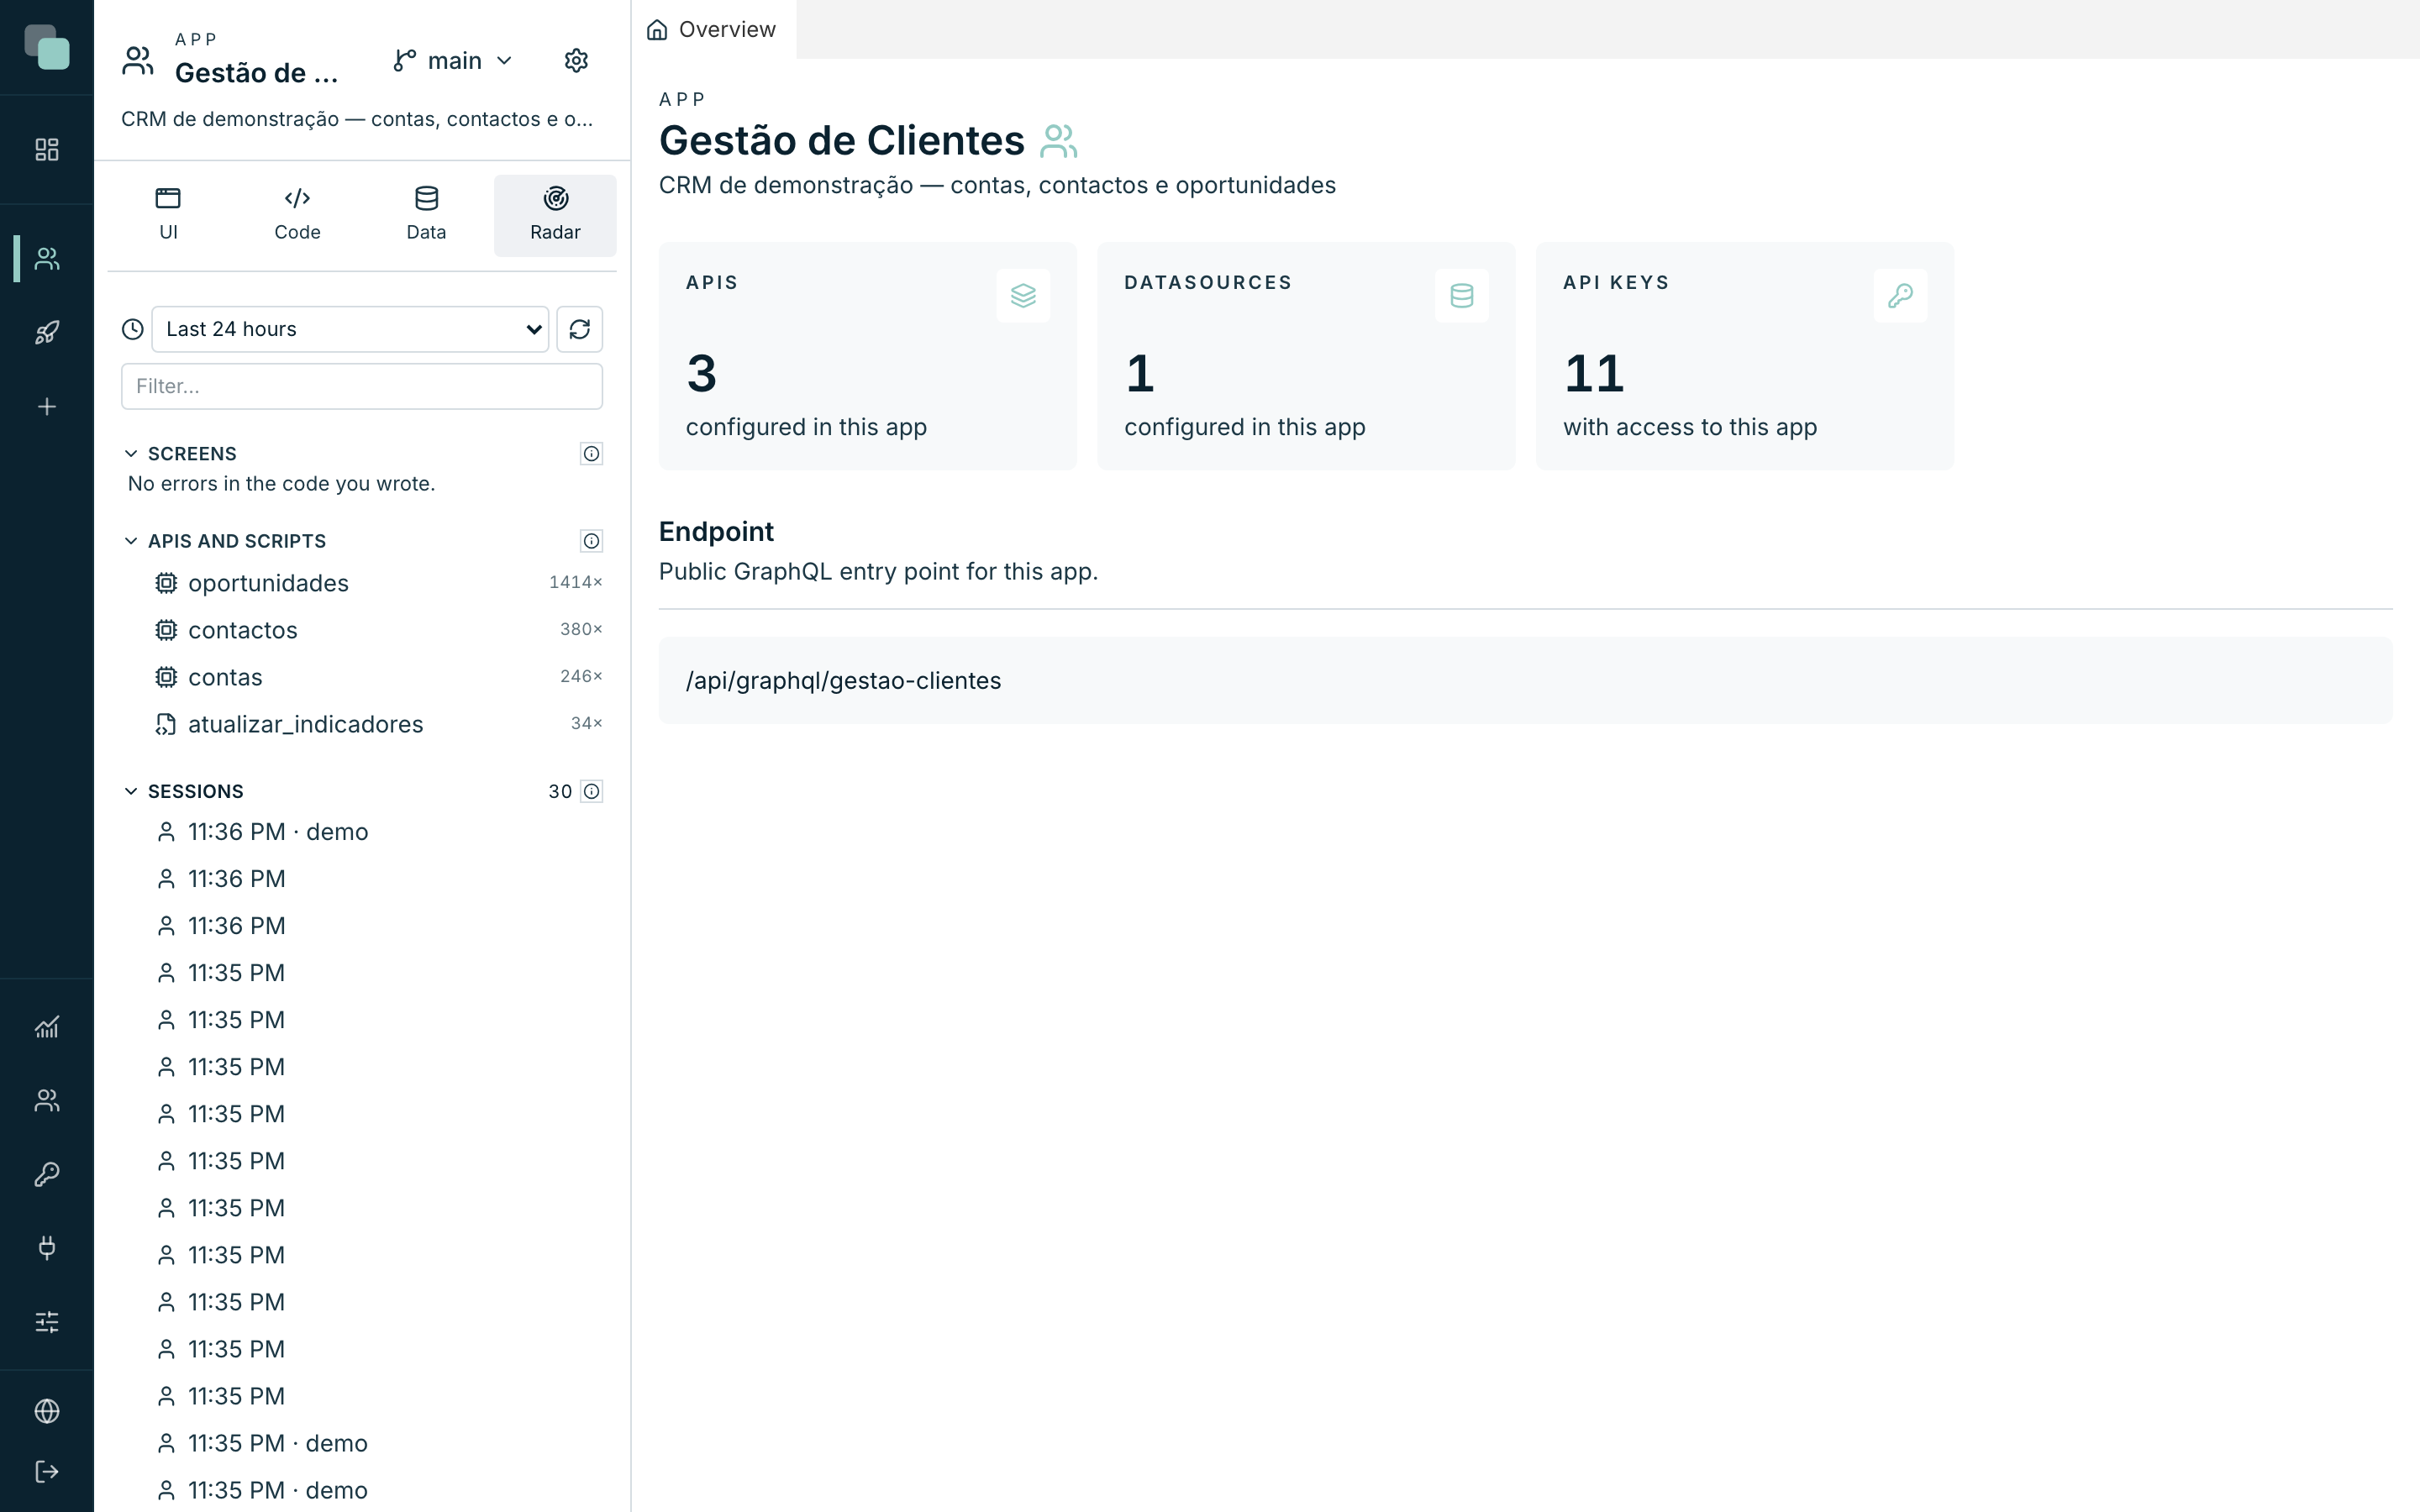
It is the Radar's time axis: the other sections tell what, the sessions tell in what order.
From the platform
There is a fourth section, which only appears when there is something to show: From the platform. These are internal runtime errors — "they do not come from your code", says the help. They appear collapsed, at the end, because there is nothing to fix on your side; it is worth reporting them with the Reference the panel shows.
Observability: every app at once
Click Observability in the left sidebar, in the administration area. It is the same matter seen from above, with a bar of sections below the header: Overview, Issues, Events, State and Audit.
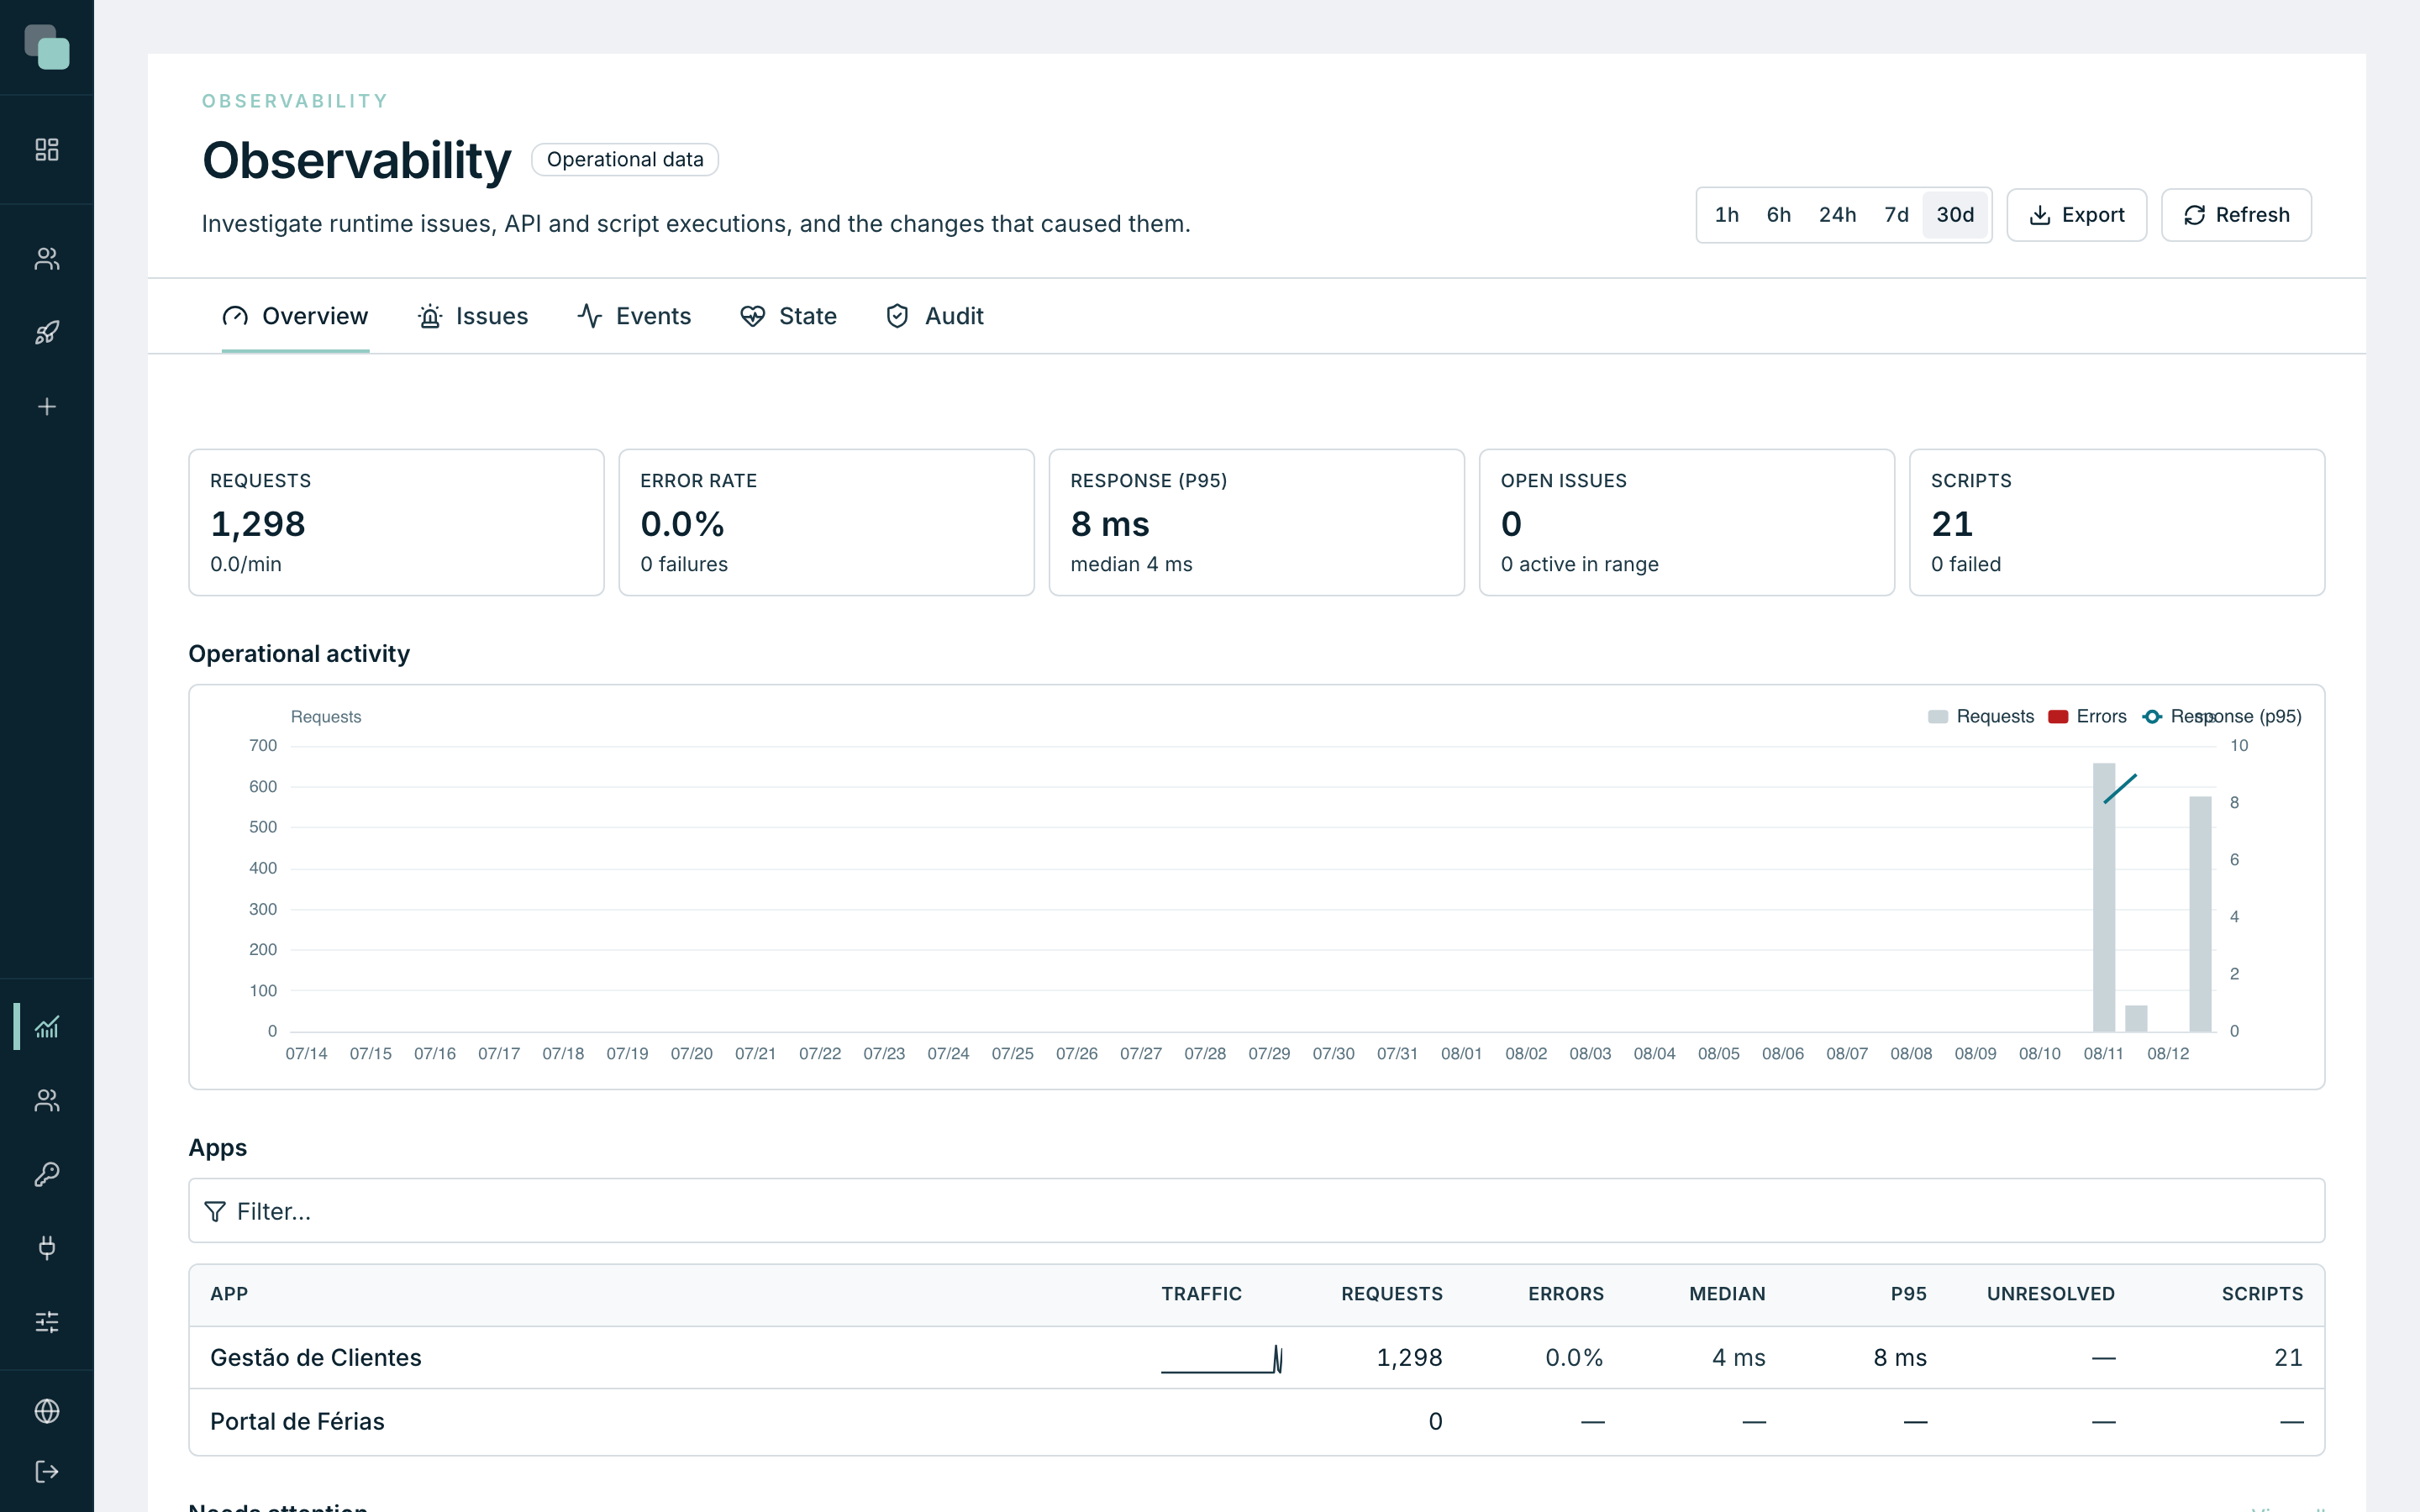
The top has a period selector common to all sections — 1h, 6h, 24h, 7d, 30d and All — plus Export (as CSV or JSON) and Refresh.
The Overview opens with five numbers:
| Card | What it counts |
|---|---|
| Requests | How many calls there were in the period, and the rate per minute. |
| Error rate | The percentage of failed calls, and how many failures there were. |
| Response (p95) | The time under which 95% of the calls stayed, with the median beside it. |
| Open issues | Grouped errors nobody has resolved yet. |
| Scripts | Script runs, and how many failed. |
Below, the Operational activity chart and the Apps table — one row per app, with traffic, requests, errors, median, p95, unresolved issues and scripts. Click an app's name to see only its events.
The other Observability sections
| Section | What is there |
|---|---|
| Issues | Runtime errors, grouped: one issue, with all of its occurrences. Each one has a state — open, resolved, ignored. |
| Events | One row per execution — APIs, scripts and system —, including the ones that went well. |
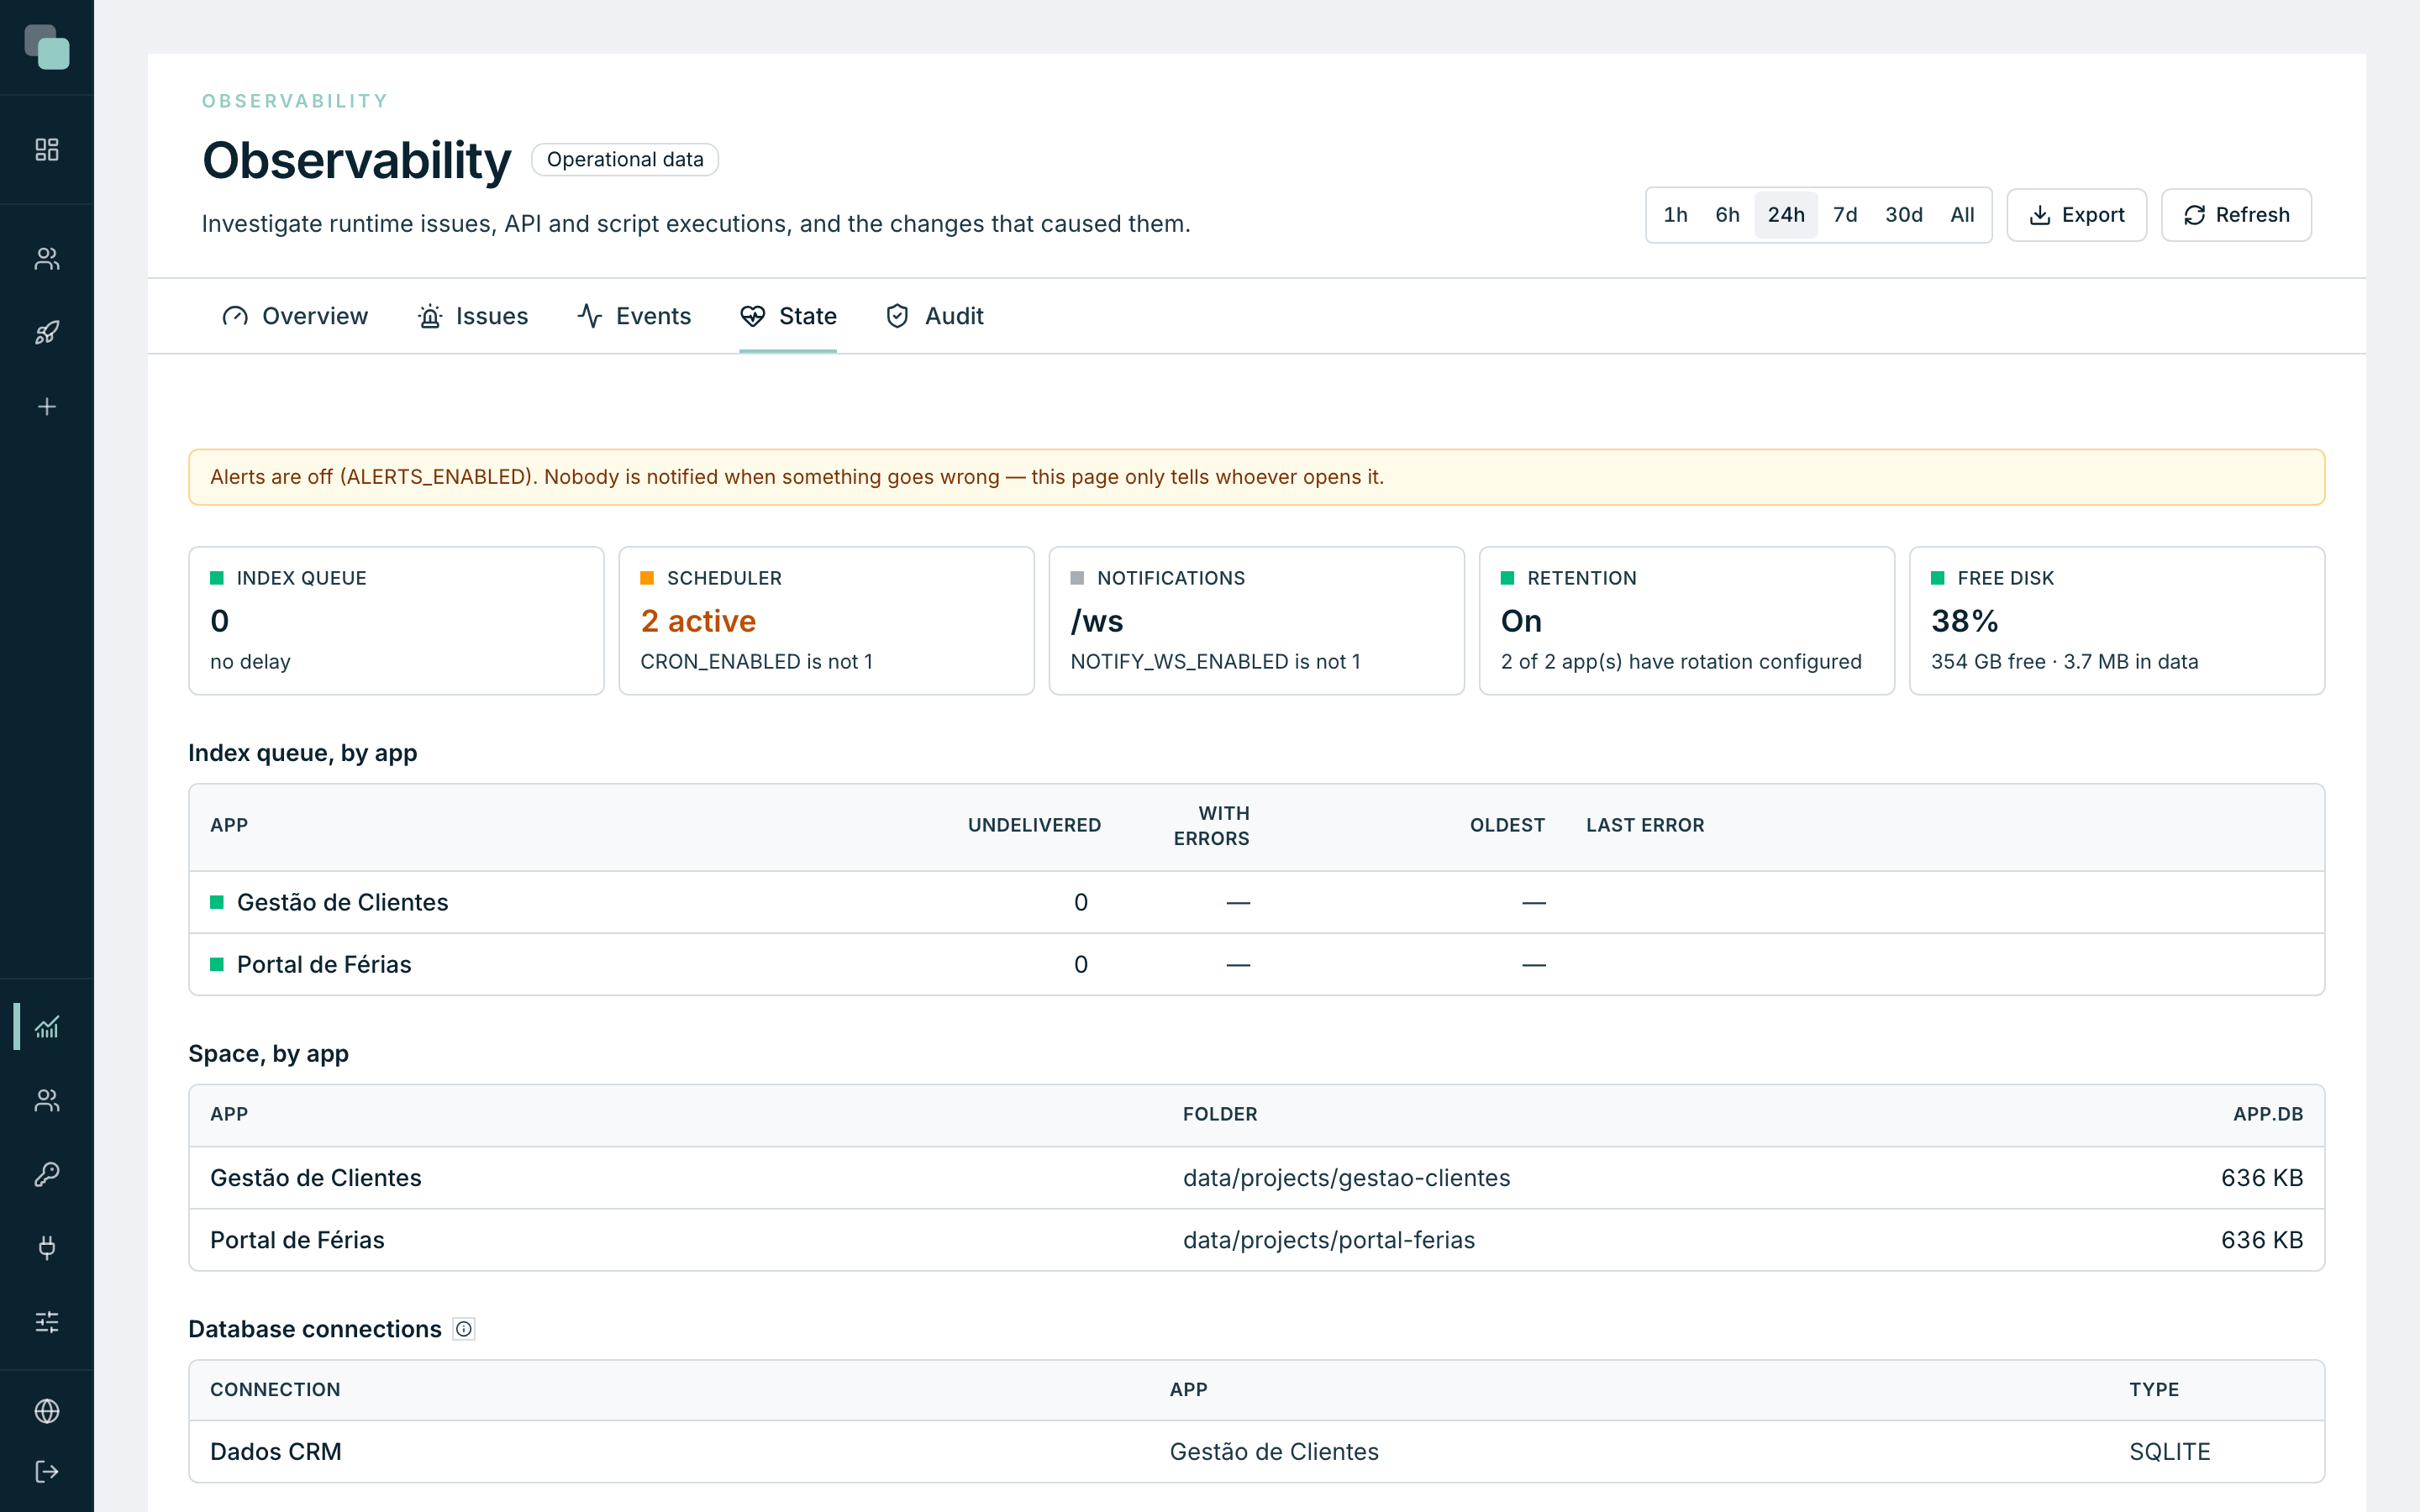
| State | The installation's health: index queue, scheduler, notifications, retention, free disk and each app's database connections. |
| Audit | The administrative and configuration changes: who created, changed, deleted or ran what. |
Tip
When somebody says "the application is slow", start with the Overview on the 24h period: if the Response (p95) is high and the Error rate low, the problem is performance and not breakage — and the Apps table tells you right away which one it is.
How long the records stay
The records do not grow forever: each app has a record rotation in its settings, saying how many days to keep of each kind. The State section shows whether the rotation is on and in how many apps.
Warning
A problem that no longer shows up may have been taken by the rotation. Its panel says so in as many words: "This problem no longer exists — record rotation may have removed it." If you need to keep things longer, it is in the app's settings that it changes.
Why can't I see…?
- …anything in the Radar tree? The period. Move the selector to All — a little-used app has no traffic in the last hour.
- …the Radar minitab? You are outside an app. The Radar is per app; the global version is the Observability menu.
- …numbers in the Overview, even with the app being used? The observability index may be off in the platform's Settings — in that case, the State section warns that "screens show stale data".
- …the Observability menu? It is an administration menu. With a developer profile it does not appear.